
Page 309 - Vibrational Spectroscopic Imaging for Biomedical Applications
P. 309
Raman Imaging for Biomedical Applications in Clinics 283
2933 1449 1339 1318 1004 2883 2850 1441
1658 1255 2932 1298 1087
1377 1093 936 1655 1063
1577 1208 854 784 757 1129 718 700
644 622 1740
A D
1448 1442 1451 1441
E
B 1448
1448
C F
3400 3200 3000 2800 1700 1500 1300 1100 900 700 3400 3200 3000 2800 1700 1500 1300 1100 900 700
–1
Raman Shift (cm )
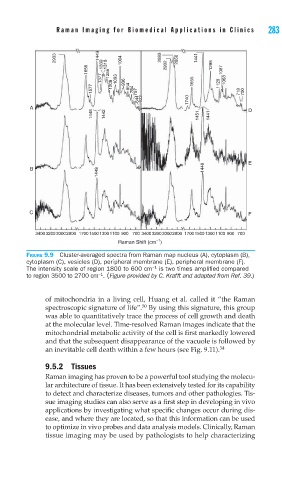
FIGURE 9.9 Cluster-averaged spectra from Raman map nucleus (A), cytoplasm (B),
cytoplasm (C), vesicles (D), peripheral membrane (E), peripheral membrane (F).
−1
The intensity scale of region 1800 to 600 cm is two times amplifi ed compared
to region 3500 to 2700 cm . (Figure provided by C. Krafft and adapted from Ref. 39.)
−1
of mitochondria in a living cell, Huang et al. called it “the Raman
spectroscopic signature of life”. By using this signature, this group
50
was able to quantitatively trace the process of cell growth and death
at the molecular level. Time-resolved Raman images indicate that the
mitochondrial metabolic activity of the cell is first markedly lowered
and that the subsequent disappearance of the vacuole is followed by
an inevitable cell death within a few hours (see Fig. 9.11). 34
9.5.2 Tissues
Raman imaging has proven to be a powerful tool studying the molecu-
lar architecture of tissue. It has been extensively tested for its capability
to detect and characterize diseases, tumors and other pathologies. Tis-
sue imaging studies can also serve as a first step in developing in vivo
applications by investigating what specific changes occur during dis-
ease, and where they are located, so that this information can be used
to optimize in vivo probes and data analysis models. Clinically, Raman
tissue imaging may be used by pathologists to help characterizing