
Page 308 - Vibrational Spectroscopic Imaging for Biomedical Applications
P. 308
282 Cha pte r Ni ne
(a) (d)
(b)
(e)
(c)
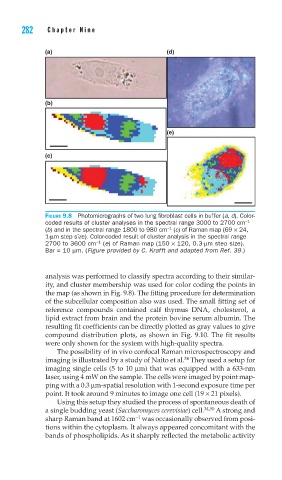
FIGURE 9.8 Photomicrographs of two lung fi broblast cells in buffer (a, d). Color-
coded results of cluster analyses in the spectral range 3000 to 2700 cm −1
−1
(b) and in the spectral range 1800 to 980 cm (c) of Raman map (69 × 24,
1-μm step size). Color-coded result of cluster analysis in the spectral range
−1
2700 to 3600 cm (e) of Raman map (150 × 120, 0.3-μm step size).
Bar = 10 μm. (Figure provided by C. Krafft and adapted from Ref. 39.)
analysis was performed to classify spectra according to their similar-
ity, and cluster membership was used for color coding the points in
the map (as shown in Fig. 9.8). The fitting procedure for determination
of the subcellular composition also was used. The small fitting set of
reference compounds contained calf thymus DNA, cholesterol, a
lipid extract from brain and the protein bovine serum albumin. The
resulting fit coefficients can be directly plotted as gray values to give
compound distribution plots, as shown in Fig. 9.10. The fit results
were only shown for the system with high-quality spectra.
The possibility of in vivo confocal Raman microspectroscopy and
34
imaging is illustrated by a study of Naito et al. They used a setup for
imaging single cells (5 to 10 μm) that was equipped with a 633-nm
laser, using 4 mW on the sample. The cells were imaged by point map-
ping with a 0.3 μm-spatial resolution with 1-second exposure time per
point. It took around 9 minutes to image one cell (19 × 21 pixels).
Using this setup they studied the process of spontaneous death of
a single budding yeast (Saccharomyces cerevisiae) cell. 34,50 A strong and
−1
sharp Raman band at 1602 cm was occasionally observed from posi-
tions within the cytoplasm. It always appeared concomitant with the
bands of phospholipids. As it sharply reflected the metabolic activity