
Page 313 - Vibrational Spectroscopic Imaging for Biomedical Applications
P. 313
1
2
3
4
5
6
7
8
9
10
Gd Gd
11
12
G 13 G
14
15
16
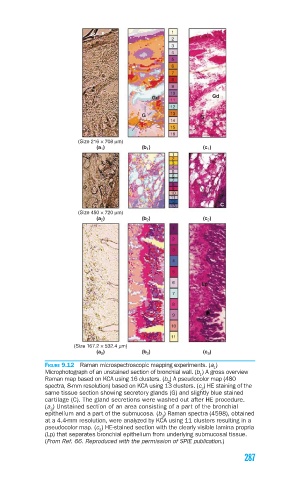
(Size 216 × 708 μm)
(a 1 ) (b 1 ) (c 1 )
1
2
3
4
5
6
7
8
9
10
11
12
13 C
(Size 450 × 720 μm)
(a 2 ) (b 2 ) (c 2 )
1
2
3
4
5
6 Lp
7
8
9
10
11
(Size 167.2 × 532.4 μm)
(a 3 ) (b 3 ) (c 3 )
FIGURE 9.12 Raman microspectroscopic mapping experiments. (a )
1
Microphotograph of an unstained section of bronchial wall. (b ) A gross overview
1
Raman map based on KCA using 16 clusters. (b ) A pseudocolor map (480
2
spectra, 8-mm resolution) based on KCA using 13 clusters. (c ) HE staining of the
2
same tissue section showing secretory glands (G) and slightly blue stained
cartilage (C). The gland secretions were washed out after HE procedure.
(a ) Unstained section of an area consisting of a part of the bronchial
3
epithelium and a part of the submucosa. (b ) Raman spectra (4598), obtained
3
at a 4.4-mm resolution, were analyzed by KCA using 11 clusters resulting in a
pseudocolor map. (c ) HE-stained section with the clearly visible lamina propria
3
(Lp) that separates bronchial epithelium from underlying submucosal tissue.
(From Ref. 66. Reproduced with the permission of SPIE publication.)
287