
Page 317 - Vibrational Spectroscopic Imaging for Biomedical Applications
P. 317
Raman Imaging for Biomedical Applications in Clinics 291
(a) Interstitial Bone
Polarization
Direction
Osteonal Bone
(b)
Polarization Polarization
Direction Direction
60 μm
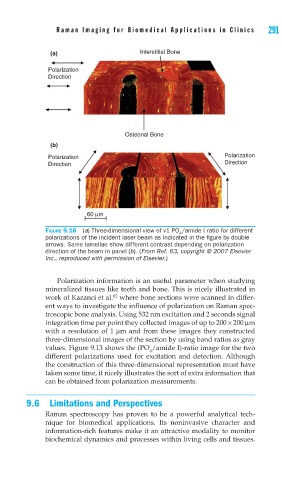
FIGURE 9.16 (a) Three-dimensional view of v1 PO /amide I ratio for different
4
polarizations of the incident laser beam as indicated in the fi gure by double
arrows. Same lamellae show different contrast depending on polarization
direction of the beam in panel (b). (From Ref. 63, copyright © 2007 Elsevier
Inc., reproduced with permission of Elsevier.)
Polarization information is an useful parameter when studying
mineralized tissues like teeth and bone. This is nicely illustrated in
work of Kazanci et al. where bone sections were scanned in differ-
62
ent ways to investigate the influence of polarization on Raman spec-
troscopic bone analysis. Using 532 nm excitation and 2 seconds signal
integration time per point they collected images of up to 200 × 200 μm
with a resolution of 1 μm and from these images they constructed
three-dimensional images of the section by using band ratios as gray
values. Figure 9.13 shows the (PO /amide I)-ratio image for the two
4
different polarizations used for excitation and detection. Although
the construction of this three-dimensional representation must have
taken some time, it nicely illustrates the sort of extra information that
can be obtained from polarization measurements.
9.6 Limitations and Perspectives
Raman spectroscopy has proven to be a powerful analytical tech-
nique for biomedical applications. Its noninvasive character and
information-rich features make it an attractive modality to monitor
biochemical dynamics and processes within living cells and tissues.