
Page 316 - Vibrational Spectroscopic Imaging for Biomedical Applications
P. 316
290 Cha pte r Ni ne
(a) (b)
(c) (d)
(e) (f) (g)
(h) (i) (j)
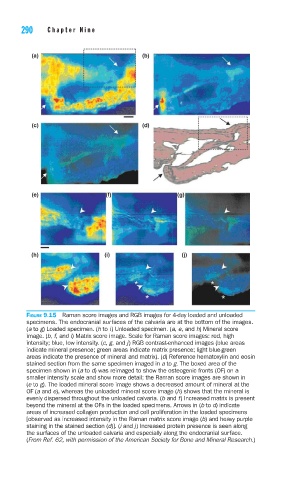
FIGURE 9.15 Raman score images and RGB images for 4-day loaded and unloaded
specimens. The endocranial surfaces of the calvaria are at the bottom of the images.
(a to g) Loaded specimen. (h to i) Unloaded specimen. (a, e, and h) Mineral score
image. (b, f, and i) Matrix score image. Scale for Raman score images: red, high
intensity; blue, low intensity. (c, g, and j) RGB contrast-enhanced images (blue areas
indicate mineral presence; green areas indicate matrix presence; light blue-green
areas indicate the presence of mineral and matrix). (d) Reference hematoxylin and eosin
stained section from the same specimen imaged in a to g. The boxed area of the
specimen shown in (a to d) was reimaged to show the osteogenic fronts (OF) on a
smaller intensity scale and show more detail; the Raman score images are shown in
(e to g). The loaded mineral score image shows a decreased amount of mineral at the
OF (a and e), whereas the unloaded mineral score image (h) shows that the mineral is
evenly dispersed throughout the unloaded calvaria. (b and f) Increased matrix is present
beyond the mineral at the OFs in the loaded specimens. Arrows in (b to d) indicate
areas of increased collagen production and cell proliferation in the loaded specimens
[observed as increased intensity in the Raman matrix score image (b) and heavy purple
staining in the stained section (d)]. (i and j) Increased protein presence is seen along
the surfaces of the unloaded calvaria and especially along the endocranial surface.
(From Ref. 62, with permission of the American Society for Bone and Mineral Research.)