
Page 314 - Vibrational Spectroscopic Imaging for Biomedical Applications
P. 314
288 Cha pte r Ni ne
4000 1436
3500 1266 1296
3000
Y size (μm) 2000 700 718 782 826 926 1658
(a) 2500 (e) 1002 1062 1028
1500
1000
500 12
0
0 1000 2000 3000 4000 50006000
4000 11
3500
3000
Y size (μm) 2500 (f) 10
2000
(b) 1500 9
1000
500
0 Intensity (a.u.) 8
0 1000 2000 3000 4000 5000
3500 7
3000
Y size (μm) 1500
2500
(c) 2000 (g) 6
1000
500 5
0
0 1000 2000 300040005000 60007000 4
3000
2500
(d) Y size (μm) 2000 (h) 3
1500
1000
500
0 2
0 1000 200030004000 5000600070008000
X size (μm) 1
Clusters
2 4 6 8 10 12 600 800 1000 1200 1400 1600 1800
Raman Shift (cm –1 )
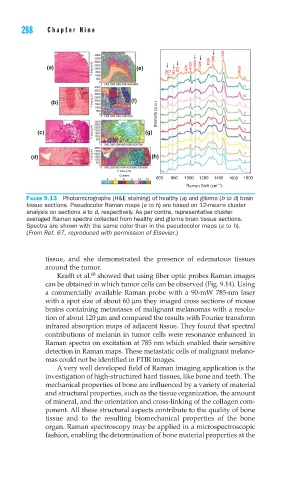
FIGURE 9.13 Photomicrographs (H&E staining) of healthy (a) and glioma (b to d) brain
tissue sections. Pseudocolor Raman maps (e to h) are based on 12-means cluster
analysis on sections a to d, respectively. As per contra, representative cluster-
averaged Raman spectra collected from healthy and glioma brain tissue sections.
Spectra are shown with the same color than in the pseudocolor maps (e to h).
(From Ref. 67, reproduced with permission of Elsevier.)
tissue, and she demonstrated the presence of edematous tissues
around the tumor.
68
Krafft et al. showed that using fiber optic probes Raman images
can be obtained in which tumor cells can be observed (Fig. 9.14). Using
a commercially available Raman probe with a 90-mW 785-nm laser
with a spot size of about 60 μm they imaged cross sections of mouse
brains containing metastases of malignant melanomas with a resolu-
tion of about 120 μm and compared the results with Fourier transform
infrared absorption maps of adjacent tissue. They found that spectral
contributions of melanin in tumor cells were resonance enhanced in
Raman spectra on excitation at 785 nm which enabled their sensitive
detection in Raman maps. These metastatic cells of malignant melano-
mas could not be identified in FTIR images.
A very well developed field of Raman imaging application is the
investigation of high-structured hard tissues, like bone and teeth. The
mechanical properties of bone are influenced by a variety of material
and structural properties, such as the tissue organization, the amount
of mineral, and the orientation and cross-linking of the collagen com-
ponent. All these structural aspects contribute to the quality of bone
tissue and to the resulting biomechanical properties of the bone
organ. Raman spectroscopy may be applied in a microspectroscopic
fashion, enabling the determination of bone material properties at the