
Page 315 - Vibrational Spectroscopic Imaging for Biomedical Applications
P. 315
Raman Imaging for Biomedical Applications in Clinics 289
(a) (b) (c)
(d) (e) (f)
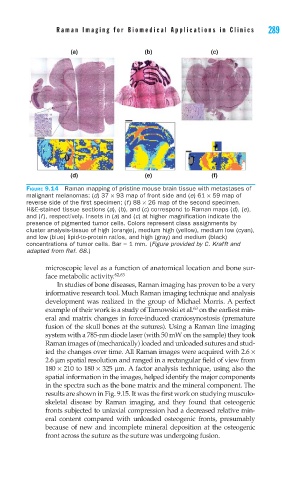
FIGURE 9.14 Raman mapping of pristine mouse brain tissue with metastases of
malignant melanomas: (d) 37 × 93 map of front side and (e) 61 × 59 map of
reverse side of the fi rst specimen; (f ) 88 × 26 map of the second specimen.
H&E-stained tissue sections (a), (b), and (c) correspond to Raman maps (d), (e),
and (f ), respectively. Insets in (a) and (c) at higher magnifi cation indicate the
presence of pigmented tumor cells. Colors represent class assignments by
cluster analysis-tissue of high (orange), medium high (yellow), medium low (cyan),
and low (blue) lipid-to-protein ratios, and high (gray) and medium (black)
concentrations of tumor cells. Bar = 1 mm. (Figure provided by C. Krafft and
adapted from Ref. 68.)
microscopic level as a function of anatomical location and bone sur-
face metabolic activity. 62,63
In studies of bone diseases, Raman imaging has proven to be a very
informative research tool. Much Raman imaging technique and analysis
development was realized in the group of Michael Morris. A perfect
example of their work is a study of Tarnowski et al. on the earliest min-
63
eral and matrix changes in force-induced craniosynostosis (premature
fusion of the skull bones at the sutures). Using a Raman line imaging
system with a 785-nm diode laser (with 50 mW on the sample) they took
Raman images of (mechanically) loaded and unloaded sutures and stud-
ied the changes over time. All Raman images were acquired with 2.6 ×
2.6 μm spatial resolution and ranged in a rectangular field of view from
180 × 210 to 180 × 325 μm. A factor analysis technique, using also the
spatial information in the images, helped identify the major components
in the spectra such as the bone matrix and the mineral component. The
results are shown in Fig. 9.15. It was the first work on studying musculo-
skeletal disease by Raman imaging, and they found that osteogenic
fronts subjected to uniaxial compression had a decreased relative min-
eral content compared with unloaded osteogenic fronts, presumably
because of new and incomplete mineral deposition at the osteogenic
front across the suture as the suture was undergoing fusion.