
Page 307 - Vibrational Spectroscopic Imaging for Biomedical Applications
P. 307
Raman Imaging for Biomedical Applications in Clinics 281
(a) (b)
800
700
600
500
400
300
200
100
(c) 110
100
1267 1658
90 1441
80
Intensity (a.u.) 60 3
70
50
40 788 1094
30 2
20
1
10
600 800 1000 1200 1400 1600 1800
–1
Raman Shift (cm )
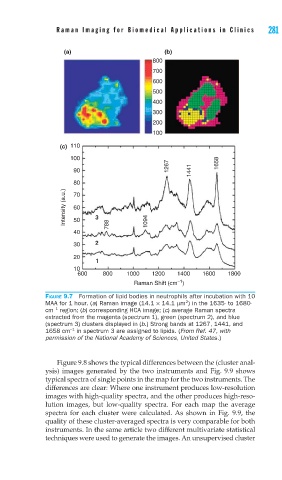
FIGURE 9.7 Formation of lipid bodies in neutrophils after incubation with 10
2
MAA for 1 hour. (a) Raman image (14.1 × 14.1 μm ) in the 1635- to 1680-
−1
cm region; (b) corresponding HCA image; (c) average Raman spectra
extracted from the magenta (spectrum 1), green (spectrum 2), and blue
(spectrum 3) clusters displayed in (b.) Strong bands at 1267, 1441, and
−1
1658 cm in spectrum 3 are assigned to lipids. (From Ref. 47, with
permission of the National Academy of Sciences, United States.)
Figure 9.8 shows the typical differences between the (cluster anal-
ysis) images generated by the two instruments and Fig. 9.9 shows
typical spectra of single points in the map for the two instruments. The
differences are clear: Where one instrument produces low-resolution
images with high-quality spectra, and the other produces high-reso-
lution images, but low-quality spectra. For each map the average
spectra for each cluster were calculated. As shown in Fig. 9.9, the
quality of these cluster-averaged spectra is very comparable for both
instruments. In the same article two different multivariate statistical
techniques were used to generate the images. An unsupervised cluster