
Page 165 - Vogel's TEXTBOOK OF QUANTITATIVE CHEMICAL ANALYSIS
P. 165
RELlABlLlTY OF RESULTS 4.10
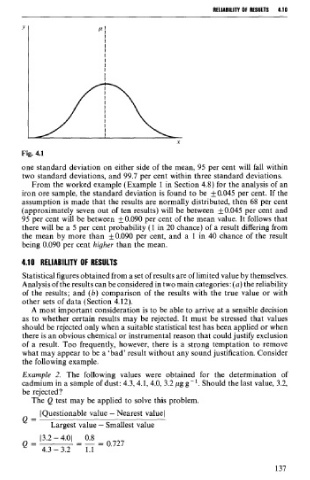
Fig. 4.1
one standard deviation on either side of the mean, 95 per cent will fa11 within
two standard deviations, and 99.7 per cent within three standard deviations.
From the worked example (Example 1 in Section 4.8) for the analysis of an
iron ore sample, the standard deviation is found to be k0.045 per cent. If the
assumption is made that the results are normally distributed, then 68 per cent
(approximately seven out of ten results) will be between k0.045 per cent and
95 per cent will be between f 0.090 per cent of the mean value. It follows that
there will be a 5 per cent probability (1 in 20 chance) of a result differing from
the mean by more than k0.090 per cent, and a 1 in 40 chance of the result
being 0.090 per cent higher than the mean.
4.1 0 RELl ABlLlTY OF RESULTS
Statistical figures obtained from a set of results are of limited value by themselves.
Analysis of the results can be considered in two main categories: (a) the reliability
of the results; and (b) comparison of the results with the true value or with
other sets of data (Section 4.12).
A most important consideration is to be able to arrive at a sensible decision
as to whether certain results may be rejected. It must be stressed that values
should be rejected only when a suitable statistical test has been applied or when
there is an obvious chemical or instrumental reason that could justify exclusion
of a result. Too frequently, however, there is a strong temptation to remove
what may appear to be a 'bad' result without any sound justification. Consider
the followin~ example.
Example 2. The following values were obtained for the determination of
cadmium in a sample of dust: 4.3,4.1, 4.0, 3.2 pg g-'. Should the last value, 3.2,
be rejected?
The Q test may be applied to solve this problem.
1 Questionable value - Nearest value 1
=
Largest value - Smallest value