
Page 170 - Vogel's TEXTBOOK OF QUANTITATIVE CHEMICAL ANALYSIS
P. 170
4 ERRORS AND STATlSTlCS
Another method of validating a new procedure is to compare the results using
samples of varying composition with the values obtained by an accepted method.
The manner of performing this calculation is best illustrated by an example:
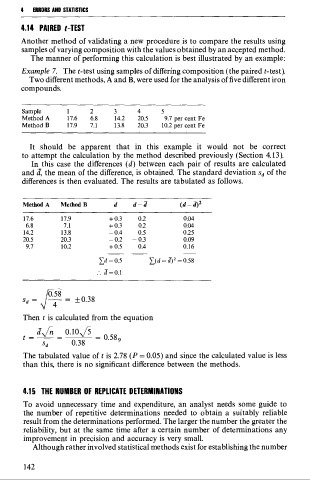
Example 7. The t-test using samples of differing composition (the paired t-test).
Two different methods, A and B, were used for the analysis of five different iron
compounds.
Sample 1 2 3 4 5
Method A 17.6 6.8 14.2 20.5 9.7 per cent Fe
Method B 17.9 7.1 13.8 20.3 10.2 per cent Fe
It should be apparent that in this example it would not be correct
to attempt the calculation by the method described previously (Section 4.13).
In this case the differences (d) between each pair of results are calculated
and $ the mean of the difference, is obtained. The standard deviation s, of the
differences is then evaluated. The results are tabulated as follows.
Method A Method B d d-d (d - d)*
Then t is calculated from the equation
The tabulated value of t is 2.78 (P = 0.05) and since the calculated value is less
than this, there is no significant difference between the methods.
4.15 THE NUMBER OF REPLICATE DETERMINATIONS
To avoid unnecessary time and expenditure, an analyst needs some guide to
the number of repetitive determinations needed to obtain a suitably reliable
result from the determinations performed. The larger the number the greater the
reliability, but at the same time after a certain number of determinations any
improvement in precision and accuracy is very small.
Although rather involved statistical methods exist for establishing the number