
Page 169 - Vogel's TEXTBOOK OF QUANTITATIVE CHEMICAL ANALYSIS
P. 169
COMPARISON OF THE MEANS OF TWO SAMPLES 4.13
expression:
where s, the pooled standard deviation, is calculated from the two sample
standard deviations s, and s,, as follows:
It should be stressed that there must not be a significant difference between the
precisions of the methods. Hence the F-test (Section 4.12) is applied prior to
using the t-test in equation (5).
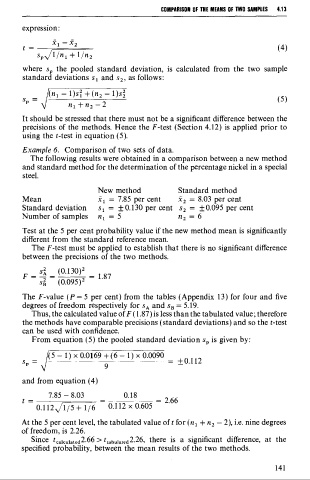
Example 6. Comparison of two sets of data.
The following results were obtained in a comparison between a new method
and standard method for the determination of the percentage nickel in a special
steel.
New method Standard method
Mean 2, = 7.85 per cent 2, = 8.03 per cent
Standard deviation s, = + 0.130 per cent s, = k0.095 per cent
Number of samples n, = 5 n, = 6
Test at the 5 per cent probability value if the new method mean is significantly
different from the standard reference mean.
The F-test must be applied to establish that there is no significant difference
between the precisions of the two methods.
The F-value (P = 5 per cent) from the tables (Appendix 13) for four and five
degrees of freedom respectively for s, and s, = 5.19.
Thus, the calculated value of F (1.87) is less than the tabulated value; therefore
the methods have comparable precisions (standard deviations) and so the t-test
can be used with confidence.
From equation (5) the pooled standard deviation s, is given by:
and from equation (4)
At the 5 per cent level, the tabulated value of t for (n, + n, - 2), i.e. nine degrees
of freedom, is 2.26.
Since tca,cu,led2.66 > tl,,u,aled2.26, there is a significant difference, at the
specified probability, between the mean results of the two methods.