
Page 172 - Vogel's TEXTBOOK OF QUANTITATIVE CHEMICAL ANALYSIS
P. 172
4.16 CORRELATION AND REGRESSION
When using instrumental methods it is often necessary to carry out a calibration
procedure by using a series of samples (standards) each having a known
concentration of the analyte to be determined. A calibration curve is constructed
by measuring the instrumental signal for each standard and plotting this response
against concentration (See Sections 17.14 and 17.21). Provided the same
experimental conditions are used for the measurement of the standards and for
the test (unknown) sample, the concentration of the latter may be determined
from the calibration curve by graphical interpolation.
There are two statistical tests that should be applied to a calibration curve:
(a) to ascertain if the graph is linear, or in the form of a curve;
(b) to evaiuate the best straight line (or curve) throughout the data points.
Correlation coefficient. In order to establish whether there is a linear relationship
between two variables x, and y, the Pearson's correlation coefficient r is used.
where n is the number of data points.
The value of r must lie between + 1 and - 1: the nearer it is to + 1, or in
the case of negative correlation to - 1, then the greater the probability that a
definite linear relationship exists between the variables x and y. Values of r that
tend towards zero indicate that x and y are not linearly related (they may be
related in a non-linear fashion).
Although the correlation coefficient r would easily be calculated with the aid
of a modern calculator or computer package, the following example will show
how the value of r can be obtained.
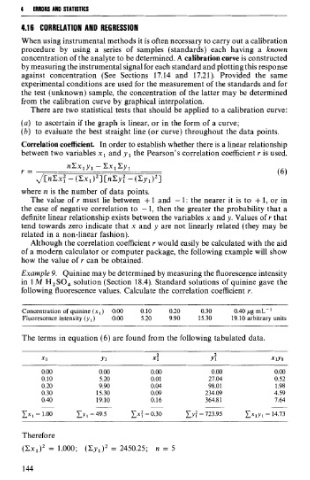
Example 9. Quinine may be determined by measuring the fluorescence intensity
in 1 M H2S0, solution (Section 18.4). Standard solutions of quinine gave the
following fluorescence values. Calculate the correlation coefficient r.
Concentration of quinine (x,) 0.00 0.10 0.20 0.30 0.40 pg mL- '
Fluorescence intensity (y,) 0.00 5.20 9.90 15.30 19.10 arbitrary units
The terms in equation (6) are found from the following tabulated data.
Therefore
(Cx,)' = 1.000; (Cy1)' = 2450.25; n = 5