Page 91 - Water Engineering Hydraulics, Distribution and Treatment
P. 91

Drawdown at the well,
                                                                      a = 304.8m
                                                                     r = 610 mm∕2 = 305 mm = 0.305 m
                                                                      w
                                                                     s = 3.5 log(2 × 304.8∕0.305) = 11.55 m.
                                                                      w
                                      Drawdown at 152.4 m (or 500 ft) from the stream:
                                                                     r = 152.4m
                                                                     r = a + r = 304.8m + 152.4m = 457.2m
                                                                      i
                                                                     s = 3.5 log(457.2∕152.4) = 1.67 m.
                                      Drawdown at 457.2 m (or 1,500 ft) from the stream:                       3.13 Aquifer Boundaries  69
                                                                      r = 457.2m
                                                                      r = a + r = 304.8m + 457.2m = 762 m
                                                                      i
                                                                      s = 3.5 log(762∕457.2) = 0.78 m.
                                      The results are shown in Fig. 3.10.
                                       For a well located near a stream, the proportion of  waste disposal (or artificial recharge) and for water supply in
                                    the discharge of the well diverted directly from the source  the same area. The recirculation can be minimized by locating
                                    of recharge depends on the distance of the well from the  the recharge well directly downstream from the discharge
                                    recharge boundary, the aquifer characteristics, and the dura-  well. The critical value of discharge and optimum spacing
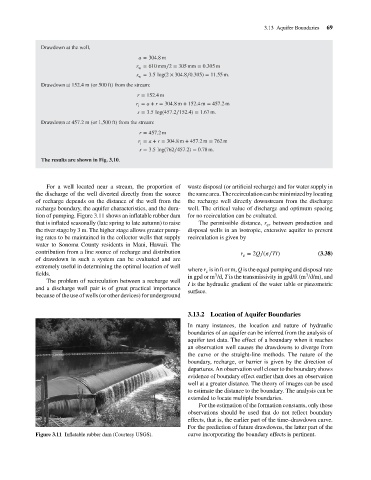
                                    tion of pumping. Figure 3.11 shows an inflatable rubber dam  for no recirculation can be evaluated.
                                    that is inflated seasonally (late spring to late autumn) to raise  The permissible distance, r , between production and
                                                                                                                c
                                    the river stage by 3 m. The higher stage allows greater pump-  disposal wells in an isotropic, extensive aquifer to prevent
                                    ing rates to be maintained in the collector wells that supply  recirculation is given by
                                    water to Sonoma County residents in Maui, Hawaii. The
                                    contribution from a line source of recharge and distribution        r = 2Q∕(  ∕TI)           (3.38)
                                                                                                        c
                                    of drawdown in such a system can be evaluated and are
                                    extremely useful in determining the optimal location of well
                                                                                      where r is in ft or m, Q is the equal pumping and disposal rate
                                                                                            c
                                    fields.                                                    3                             3
                                                                                      in gpd or m /d, T is the transmissivity in gpd/ft (m /d/m), and
                                       The problem of recirculation between a recharge well
                                                                                      I is the hydraulic gradient of the water table or piezometric
                                    and a discharge well pair is of great practical importance
                                                                                      surface.
                                    because of the use of wells (or other devices) for underground
                                                                                      3.13.2 Location of Aquifer Boundaries
                                                                                      In many instances, the location and nature of hydraulic
                                                                                      boundaries of an aquifer can be inferred from the analysis of
                                                                                      aquifer test data. The effect of a boundary when it reaches
                                                                                      an observation well causes the drawdowns to diverge from
                                                                                      the curve or the straight-line methods. The nature of the
                                                                                      boundary, recharge, or barrier is given by the direction of
                                                                                      departures. An observation well closer to the boundary shows
                                                                                      evidence of boundary effect earlier than does an observation
                                                                                      well at a greater distance. The theory of images can be used
                                                                                      to estimate the distance to the boundary. The analysis can be
                                                                                      extended to locate multiple boundaries.
                                                                                          For the estimation of the formation constants, only those
                                                                                      observations should be used that do not reflect boundary
                                                                                      effects, that is, the earlier part of the time–drawdown curve.
                                                                                      For the prediction of future drawdowns, the latter part of the
                                    Figure 3.11 Inflatable rubber dam (Courtesy USGS).  curve incorporating the boundary effects is pertinent.
   86   87   88   89   90   91   92   93   94   95   96