
Page 93 - Water Engineering Hydraulics, Distribution and Treatment
P. 93
71
3.15 Yield of a Well
100
permits the characteristics of the aquifer and of the well that
govern the efficient performance of a water supply system
90
to be evaluated.
F p , percent of maximum specific capacity attainable
80
3.15 YIELD OF A WELL
70
For the optimal design of a well (or a well field), the combi-
nation of discharge and drawdown that gives the lowest cost
solution is sought. Both the capital outlays and the operation
60
ABCDEFG
and maintenance costs need to be considered over the eco-
Curve r b w should include a step-drawdown test, because such a test
nomic life of the structure. The interrelationship of pumping
50 A 40 rate, drawdown, and specific yield serves as a basis for the
B 60
selection of optimal design capacity. We have shown pre-
C 80
40 viously that the specific capacity decreases as the pumping
D 100
rate is increased. Hence the earlier increments of drawdown
E 120
are more effective in producing yields than the later ones,
30 F 200
G 400 that is, each additional unit of yield is more expensive than
the previous one. Increasing the yield of a well by one unit
20 is economically justified only if the cost of developing this
b Aquifer thickness unit from alternate sources, such as another well or surface
r w = Well radius
10 supplies, is higher.
Curves based on kozeny formula The yield obtainable from a well at any site depends on
(a) the hydraulic characteristics of the aquifer, which may be
given in terms of a specific capacity–drawdown relationship;
0 10 20 30 40 50 60 70 80 90 100
(b) the drawdown at the pumping well; (c) the length of the
Percent of aquifer screened
intake section of the well; (d) the effective diameter of the
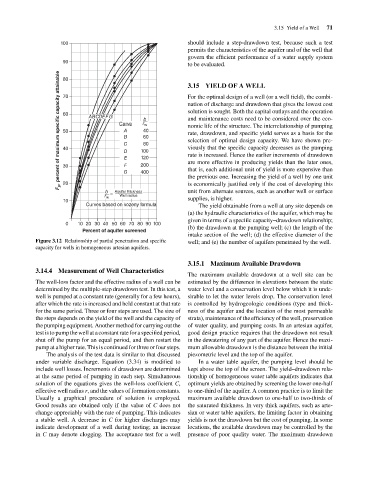
Figure 3.12 Relationship of partial penetration and specific well; and (e) the number of aquifers penetrated by the well.
capacity for wells in homogeneous artesian aquifers.
3.15.1 Maximum Available Drawdown
3.14.4 Measurement of Well Characteristics
The maximum available drawdown at a well site can be
The well-loss factor and the effective radius of a well can be estimated by the difference in elevations between the static
determined by the multiple-step drawdown test. In this test, a water level and a conservation level below which it is unde-
well is pumped at a constant rate (generally for a few hours), sirable to let the water levels drop. The conservation level
after which the rate is increased and held constant at that rate is controlled by hydrogeologic conditions (type and thick-
for the same period. Three or four steps are used. The size of ness of the aquifer and the location of the most permeable
the steps depends on the yield of the well and the capacity of strata), maintenance of the efficiency of the well, preservation
the pumping equipment. Another method for carrying out the of water quality, and pumping costs. In an artesian aquifer,
test is to pump the well at a constant rate for a specified period, good design practice requires that the drawdown not result
shut off the pump for an equal period, and then restart the in the dewatering of any part of the aquifer. Hence the maxi-
pump at a higher rate. This is continued for three or four steps. mum allowable drawdown is the distance between the initial
The analysis of the test data is similar to that discussed piezometric level and the top of the aquifer.
under variable discharge. Equation (3.34) is modified to In a water table aquifer, the pumping level should be
include well losses. Increments of drawdown are determined kept above the top of the screen. The yield–drawdown rela-
at the same period of pumping in each step. Simultaneous tionship of homogeneous water table aquifers indicates that
solution of the equations gives the well-loss coefficient C, optimum yields are obtained by screening the lower one-half
effective well radius r, and the values of formation constants. to one-third of the aquifer. A common practice is to limit the
Usually a graphical procedure of solution is employed. maximum available drawdown to one-half to two-thirds of
Good results are obtained only if the value of C does not the saturated thickness. In very thick aquifers, such as arte-
change appreciably with the rate of pumping. This indicates sian or water table aquifers, the limiting factor in obtaining
a stable well. A decrease in C for higher discharges may yields is not the drawdown but the cost of pumping. In some
indicate development of a well during testing; an increase locations, the available drawdown may be controlled by the
in C may denote clogging. The acceptance test for a well presence of poor quality water. The maximum drawdown