
Page 166 - Water and wastewater engineering
P. 166
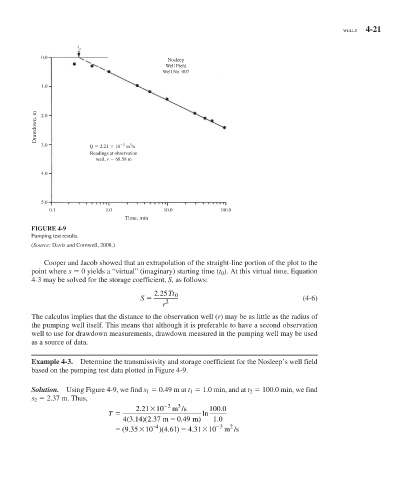
WELLS 4-21

                       t
                       o
             0.0
                                                Nosleep
                                                Well Field
                                               Well No. 007
             1.0


           Drawdown, m  2.0


             3.0          Q   2.21   10  m /s
                                      3
                                    2
                          Readings at observation
                            well, r   68.58 m
             4.0


             5.0
               0.1             1.0             10.0            100.0
                                    Time, min
            FIGURE 4-9
           Pumping test results.
           ( Source:  Davis and Cornwell, 2008.)

             Cooper and Jacob showed that an extrapolation of the straight-line portion of the plot to the
          point where  s      0 yields a “virtual” (imaginary) starting time ( t   0  ). At this virtual time, Equation
          4-3 may be solved for the storage coefficient,  S,  as follows:

                                             225  Tt 0
                                              .
                                            S    2                                       (4-6)
                                               r
           The calculus implies that the distance to the observation well ( r ) may be as little as the radius of
          the pumping well itself. This means that although it is preferable to have a second observation
          well to use for drawdown measurements, drawdown measured in the pumping well may be used
          as a source of data.


            Example 4-3.   Determine the transmissivity and storage coefficient for the Nosleep’s well field
          based on the pumping test data plotted in  Figure 4-9 .


            Solution.   Using  Figure 4-9 , we find  s   1       0.49 m at  t   1       1.0 min, and at  t   2       100.0 min, we find
            s   2       2.37 m. Thus,
                                                2  3
                                       221  10    m /s      100..0
                                         .
                                T                         ln
                                     (
                                       .
                                    4 3 14 2 37 m   0 49.  m)  . 10
                                         )
                                          (
                                            .
                                            − 4                 3  2

                                   (  . 9 35  10 )(  . 4 61  )  . 4 3110  m /s