
Page 397 - Water and wastewater engineering
P. 397
10-14 WATER AND WASTEWATER ENGINEERING
Solution. The plot is shown in Figure 10-8 .
a. Calculate the overflow rate for each intersection point. For example, for the 50% line,
20 . m
v 1 440 min/d) 82 3. m
, (
o
35min
b. The corresponding removal percentage is
.
1 5 . 085
R T50 50 ( 55 50 ( 60 55)
)
20 . 20 .
060 040
.
.
( 65 60) ( 70 65)
0
2.0 20 .
.
5
020 00 . 5
( 75 70) ( 100 75)
20 . 20 .
59 5 or 60%
.
c. The corresponding detention time is taken from the intersection of the isoconcentration
line and the x -axis used to define the overflow rate, that is, 35 minutes for the 50% line.
d. This calculation is repeated for each isoconcentration line that intersects the x -axis,
except the last ones for which data are too sparse, that is, 30, 40, 50, 55, 60, and 65%, but
not 70 or 75%.
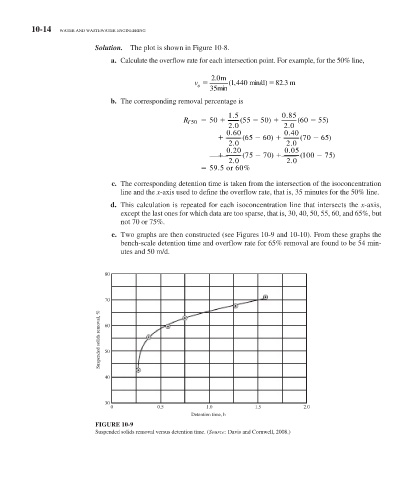
e. Two graphs are then constructed (see Figures 10-9 and 10-10 ). From these graphs the
bench-scale detention time and overflow rate for 65% removal are found to be 54 min-
utes and 50 m/d.
80
70
Suspended solids removal, % 60
50
40
30
0 0.5 1.0 1.5 2.0
Detention time, h
FIGURE 10-9
Suspended solids removal versus detention time. ( Source: Davis and Cornwell, 2008.)