
Page 396 - Water and wastewater engineering
P. 396
SEDIMENTATION 10-13
0.0
100%
75%
0.5 41 50 60 67 72 73 76
H 3
R a H
2
1.0 19 33 R 45 R 58 62 70 74 74
Depth, m 30% b 40% c 50% 55% 60% 65% 70%
1.5 H
1
2.0 15 31 38 54 59 63 71
t a
0 5 10 20 30 40 50 60 70 80 90 100 120
Sampling time, min
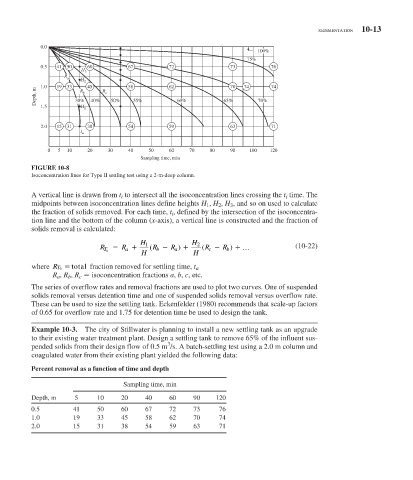
FIGURE 10-8
Isoconcentration lines for Type II settling test using a 2-m-deep column.
A vertical line is drawn from t i to intersect all the isoconcentration lines crossing the t i time. The
midpoints between isoconcentration lines define heights H 1 , H 2 , H 3 , and so on used to calculate
the fraction of solids removed. For each time, t i , defined by the intersection of the isoconcentra-
tion line and the bottom of the column ( x -axis), a vertical line is constructed and the fraction of
solids removal is calculated:
H 1 H 2
R a ( R b R a ( R c R b … (10-22)
)
)
R T 0
H H
where RT 0 total fraction removed for settling time, t a
R a , R b , R c isoconcentration fractions a, b, c, etc.
The series of overflow rates and removal fractions are used to plot two curves. One of suspended
solids removal versus detention time and one of suspended solids removal versus overflow rate.
These can be used to size the settling tank. Eckenfelder (1980) recommends that scale-up factors
of 0.65 for overflow rate and 1.75 for detention time be used to design the tank.
Example 10-3. The city of Stillwater is planning to install a new settling tank as an upgrade
to their existing water treatment plant. Design a settling tank to remove 65% of the influent sus-
3
pended solids from their design flow of 0.5 m /s. A batch-settling test using a 2.0 m column and
coagulated water from their existing plant yielded the following data:
Percent removal as a function of time and depth
Sampling time, min
Depth, m 5 10 20 40 60 90 120
0.5 41 50 60 67 72 73 76
1.0 19 33 45 58 62 70 74
2.0 15 31 38 54 59 63 71