
Page 61 - Water and wastewater engineering
P. 61
2-4 WATER AND WASTEWATER ENGINEERING
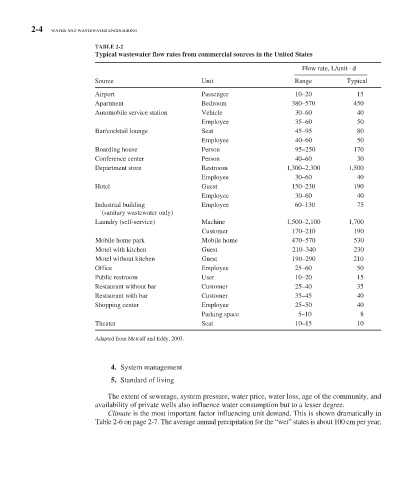
TABLE 2-2
Typical wastewater flow rates from commercial sources in the United States
Flow rate, L/unit · d
Source Unit Range Typical
Airport Passenger 10–20 15
Apartment Bedroom 380–570 450
Automobile service station Vehicle 30–60 40
Employee 35–60 50
Bar/cocktail lounge Seat 45–95 80
Employee 40–60 50
Boarding house Person 95–250 170
Conference center Person 40–60 30
Department store Restroom 1,300–2,300 1,500
Employee 30–60 40
Hotel Guest 150–230 190
Employee 30–60 40
Industrial building Employee 60–130 75
(sanitary wastewater only)
Laundry (self-service) Machine 1,500–2,100 1,700
Customer 170–210 190
Mobile home park Mobile home 470–570 530
Motel with kitchen Guest 210–340 230
Motel without kitchen Guest 190–290 210
Office Employee 25–60 50
Public restroom User 10–20 15
Restaurant without bar Customer 25–40 35
Restaurant with bar Customer 35–45 40
Shopping center Employee 25–50 40
Parking space 5–10 8
Theater Seat 10–15 10
Adapted from Metcalf and Eddy, 2003.
4. System management
5. Standard of living
The extent of sewerage, system pressure, water price, water loss, age of the community, and
availability of private wells also influence water consumption but to a lesser degree.
Climate is the most important factor influencing unit demand. This is shown dramatically in
Table 2-6 on page 2-7. The average annual precipitation for the “wet” states is about 100 cm per year,