
Page 62 - Water and wastewater engineering
P. 62
GENERAL WATER SUPPLY DESIGN CONSIDERATIONS 2-5
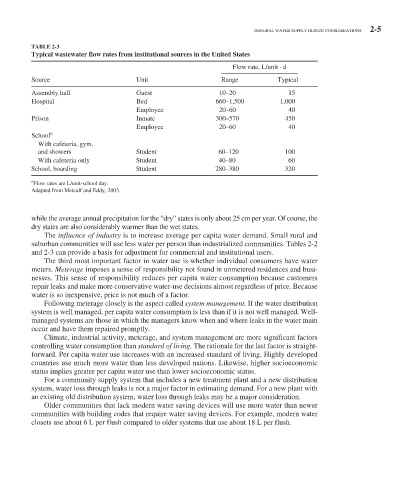
TABLE 2-3
Typical wastewater flow rates from institutional sources in the United States
Flow rate, L/unit · d
Source Unit Range Typical
Assembly hall Guest 10–20 15
Hospital Bed 660–1,500 1,000
Employee 20–60 40
Prison Inmate 300–570 450
Employee 20–60 40
School a
With cafeteria, gym,
and showers Student 60–120 100
With cafeteria only Student 40–80 60
School, boarding Student 280–380 320
a
Flow rates are L/unit-school day.
Adapted from Metcalf and Eddy, 2003.
while the average annual precipitation for the “dry” states is only about 25 cm per year. Of course, the
dry states are also considerably warmer than the wet states.
The influence of industry is to increase average per capita water demand. Small rural and
suburban communities will use less water per person than industrialized communities. Tables 2-2
and 2-3 can provide a basis for adjustment for commercial and institutional users.
The third most important factor in water use is whether individual consumers have water
meters. Meterage imposes a sense of responsibility not found in unmetered residences and busi-
nesses. This sense of responsibility reduces per capita water consumption because customers
repair leaks and make more conservative water-use decisions almost regardless of price. Because
water is so inexpensive, price is not much of a factor.
Following meterage closely is the aspect called system management. If the water distribution
system is well managed, per capita water consumption is less than if it is not well managed. Well-
managed systems are those in which the managers know when and where leaks in the water main
occur and have them repaired promptly.
Climate, industrial activity, meterage, and system management are more significant factors
controlling water consumption than standard of living. The rationale for the last factor is straight-
forward. Per capita water use increases with an increased standard of living. Highly developed
countries use much more water than less developed nations. Likewise, higher socioeconomic
status implies greater per capita water use than lower socioeconomic status.
For a community supply system that includes a new treatment plant and a new distribution
system, water loss through leaks is not a major factor in estimating demand. For a new plant with
an existing old distribution system, water loss through leaks may be a major consideration.
Older communities that lack modern water saving devices will use more water than newer
communities with building codes that require water saving devices. For example, modern water
closets use about 6 L per flush compared to older systems that use about 18 L per flush.