
Page 66 - Water and wastewater engineering
P. 66
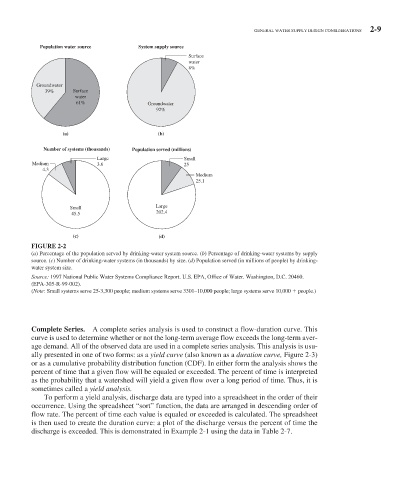
GENERAL WATER SUPPLY DESIGN CONSIDERATIONS 2-9

            Population water source     System supply source
                                                      Surface
                                                      water
                                                      8%

           Groundwater
              39%     Surface
                      water
                       61%                 Groundwater
                                             92%


                   (a)                        (b)
             Number of systems (thousands)  Population served (millions)
                            Large                    Small
          Medium            3.6                      25
             4.3
                                                        Medium
                                                        25.1


                     Small                   Large
                                             202.4
                     45.5

                      (c)                     (d)
          FIGURE 2-2
          (a) Percentage of the population served by drinking-water system source. (b) Percentage of drinking-water systems by supply
          source. (c) Number of drinking-water systems (in thousands) by size. (d) Population served (in millions of people) by drinking-
          water system size.
          Source: 1997 National Public Water Systems Compliance Report. U.S. EPA, Office of Water. Washington, D.C. 20460.
          (EPA-305-R-99-002).
          (Note: Small systems serve 25-3,300 people; medium systems serve 3301–10,000 people; large systems serve 10,000   people.)


            Complete Series.  A complete series analysis is used to construct a flow-duration curve. This
          curve is used to determine whether or not the long-term average flow exceeds the long-term aver-
          age demand. All of the observed data are used in a complete series analysis. This analysis is usu-
          ally presented in one of two forms: as a  yield curve  (also known as a  duration curve,   Figure 2-3 )
          or as a cumulative probability distribution function (CDF). In either form the analysis shows the
          percent of time that a given flow will be equaled or exceeded. The percent of time is interpreted
          as the probability that a watershed will yield a given flow over a long period of time. Thus, it is
          sometimes called a  yield analysis.
              To perform a yield analysis, discharge data are typed into a spreadsheet in the order of their
          occurrence. Using the spreadsheet “sort” function, the data are arranged in descending order of
          flow rate. The percent of time each value is equaled or exceeded is calculated. The spreadsheet
          is then used to create the duration curve: a plot of the discharge versus the percent of time the

          discharge is exceeded. This is demonstrated in  Example 2-1 using the data in  Table 2-7 .