
Page 64 - Water and wastewater engineering
P. 64
GENERAL WATER SUPPLY DESIGN CONSIDERATIONS 2-7
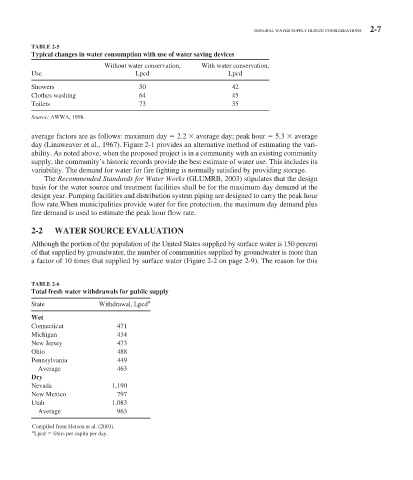
TABLE 2-5
Typical changes in water consumption with use of water saving devices
Without water conservation, With water conservation,
Use Lpcd Lpcd
Showers 50 42
Clothes washing 64 45
Toilets 73 35
Source: AWWA, 1998.
average factors are as follows: maximum day 2.2 average day; peak hour 5.3 average
day (Linaweaver et al., 1967). Figure 2-1 provides an alternative method of estimating the vari-
ability. As noted above, when the proposed project is in a community with an existing community
supply, the community’s historic records provide the best estimate of water use. This includes its
variability. The demand for water for fire fighting is normally satisfied by providing storage.
The Recommended Standards for Water Works (GLUMRB, 2003) stipulates that the design
basis for the water source and treatment facilities shall be for the maximum day demand at the
design year. Pumping facilities and distribution system piping are designed to carry the peak hour
flow rate.When municipalities provide water for fire protection, the maximum day demand plus
fire demand is used to estimate the peak hour flow rate.
2-2 WATER SOURCE EVALUATION
Although the portion of the population of the United States supplied by surface water is 150 percent
of that supplied by groundwater, the number of communities supplied by groundwater is more than
a factor of 10 times that supplied by surface water ( Figure 2-2 on page 2-9). The reason for this
TABLE 2-6
Total fresh water withdrawals for public supply
State Withdrawal, Lpcd a
Wet
Connecticut 471
Michigan 434
New Jersey 473
Ohio 488
Pennsylvania 449
Average 463
Dry
Nevada 1,190
New Mexico 797
Utah 1,083
Average 963
Compiled from Hutson et al. (2001).
a
Lpcd liters per capita per day.