
Page 63 - Water and wastewater engineering
P. 63
2-6 WATER AND WASTEWATER ENGINEERING
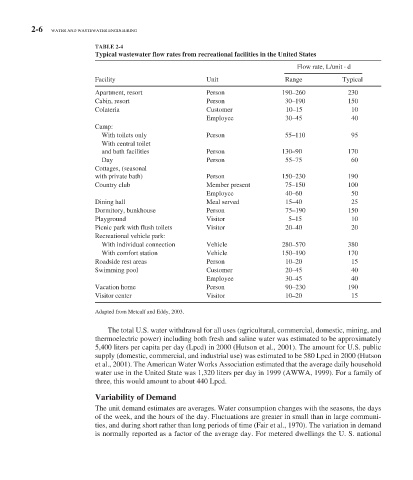
TABLE 2-4
Typical wastewater flow rates from recreational facilities in the United States
Flow rate, L/unit · d
Facility Unit Range Typical
Apartment, resort Person 190–260 230
Cabin, resort Person 30–190 150
Colateria Customer 10–15 10
Employee 30–45 40
Camp:
With toilets only Person 55–110 95
With central toilet
and bath facilities Person 130–90 170
Day Person 55–75 60
Cottages, (seasonal
with private bath) Person 150–230 190
Country club Member present 75–150 100
Employee 40–60 50
Dining hall Meal served 15–40 25
Dormitory, bunkhouse Person 75–190 150
Playground Visitor 5–15 10
Picnic park with flush toilets Visitor 20–40 20
Recreational vehicle park:
With individual connection Vehicle 280–570 380
With comfort station Vehicle 150–190 170
Roadside rest areas Person 10–20 15
Swimming pool Customer 20–45 40
Employee 30–45 40
Vacation home Person 90–230 190
Visitor center Visitor 10–20 15
Adapted from Metcalf and Eddy, 2003.
The total U.S. water withdrawal for all uses (agricultural, commercial, domestic, mining, and
thermoelectric power) including both fresh and saline water was estimated to be approximately
5,400 liters per capita per day (Lpcd) in 2000 (Hutson et al., 2001). The amount for U.S. public
supply (domestic, commercial, and industrial use) was estimated to be 580 Lpcd in 2000 (Hutson
et al., 2001). The American Water Works Association estimated that the average daily household
water use in the United State was 1,320 liters per day in 1999 (AWWA, 1999). For a family of
three, this would amount to about 440 Lpcd.
Variability of Demand
The unit demand estimates are averages. Water consumption changes with the seasons, the days
of the week, and the hours of the day. Fluctuations are greater in small than in large communi-
ties, and during short rather than long periods of time (Fair et al., 1970). The variation in demand
is normally reported as a factor of the average day. For metered dwellings the U. S. national