Page 250 - Well Logging and Formation Evaluation
P. 250

240               Well Logging and Formation Evaluation

          Exercise 10.2: Area Depth Graph


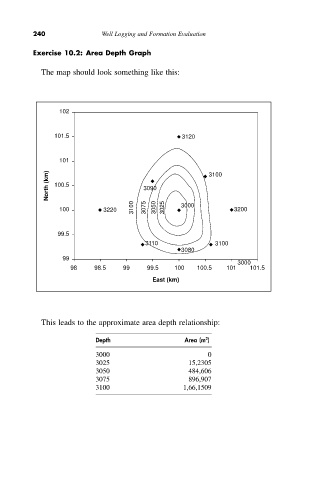
            The map should look something like this:


                 102


                101.5                             3120


                 101
              North (km)  100.5         3090             3100


                                     3100  3075  3050  3025  3000
                 100         3220                               3200


                99.5
                                        3110               3100
                                                  3080
                  99
                                                                 3000
                    98    98.5    99    99.5    100   100.5   101   101.5
                                          East (km)


            This leads to the approximate area depth relationship:
                           Depth                   Area (m )
                                                        2
                           3000                          0
                           3025                     15,2305
                           3050                     484,606
                           3075                     896,907
                           3100                   1,66,1509
   245   246   247   248   249   250   251   252   253   254   255