
Page 251 - Well Logging and Formation Evaluation
P. 251
Solutions to Exercises 241
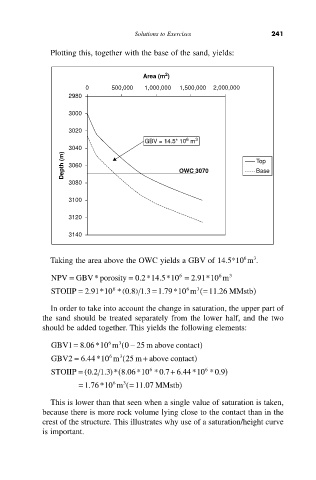
Plotting this, together with the base of the sand, yields:
2
Area (m )
0 500,000 1,000,000 1,500,000 2,000,000
2980
3000
3020
6
GBV = 14.5* 10 m 3
3040
Depth (m) 3060 OWC 3070 Top
Base
3080
3100
3120
3140
3
6
Taking the area above the OWC yields a GBV of 14.5*10 m .
6
6
NPV = GBV* porosity = 0.2*14.5*10 = 2.91*10 m 3
6
3
6
=
STOIIP = 2.91*10 * 0.8 1.3 1.79*10 m = ( 11.26 MMstb)
)
(
In order to take into account the change in saturation, the upper part of
the sand should be treated separately from the lower half, and the two
should be added together. This yields the following elements:
-
=
GBV1 8.06*10 m 0 25 m above contact)
6
(
3
3
6
GBV2 = 6.44*10 m 25 m above contact)
(
+
6
) (
6
STOIIP = ( 0.2 1.3 * 8.06*10 *0.7 6.44*10 *0.9)
+
6
3
= 1.76*10 m = ( 11.07 MMstb)
This is lower than that seen when a single value of saturation is taken,
because there is more rock volume lying close to the contact than in the
crest of the structure. This illustrates why use of a saturation/height curve
is important.