
Page 253 - Well Logging and Formation Evaluation
P. 253
Solutions to Exercises 243
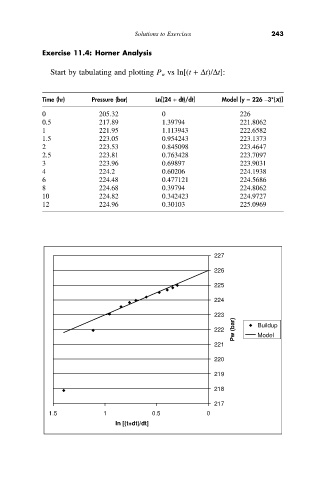
Exercise 11.4: Horner Analysis
Start by tabulating and plotting P w vs ln[(t +Dt)/Dt]:
Time (hr) Pressure (bar) Ln[(24 + dt)/dt] Model [y = 226 -3*(x)]
0 205.32 0 226
0.5 217.89 1.39794 221.8062
1 221.95 1.113943 222.6582
1.5 223.05 0.954243 223.1373
2 223.53 0.845098 223.4647
2.5 223.81 0.763428 223.7097
3 223.96 0.69897 223.9031
4 224.2 0.60206 224.1938
6 224.48 0.477121 224.5686
8 224.68 0.39794 224.8062
10 224.82 0.342423 224.9727
12 224.96 0.30103 225.0969
227
226
225
224
223
222 Pw (bar) Buildup
Model
221
220
219
218
217
1.5 1 0.5 0
In [(t+dt)/dt]