
Page 258 - Well Logging and Formation Evaluation
P. 258
248 Well Logging and Formation Evaluation
Exercise 12.2: Interpretation of Electromagnetic Homing-In Data
400
350
300
250
Angle (deg) 200 AXDIR
AXDIR meas
HSDIR
150 HSDIR meas
100
50
0
2650 2700 2750 2800 2850 2900
Depth ft md
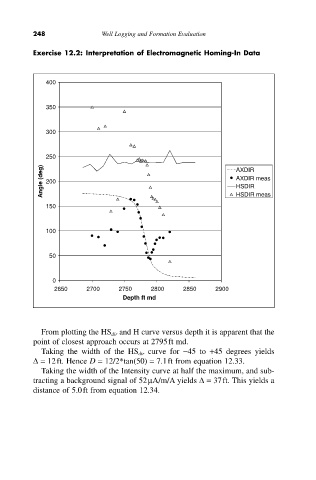
From plotting the HS dir and H curve versus depth it is apparent that the
point of closest approach occurs at 2795ft md.
Taking the width of the HS dir curve for -45 to +45 degrees yields
D= 12ft. Hence D = 12/2*tan(50) = 7.1ft from equation 12.33.
Taking the width of the Intensity curve at half the maximum, and sub-
tracting a background signal of 52mA/m/A yields D= 37ft. This yields a
distance of 5.0ft from equation 12.34.