
Page 36 - Whole Earth Geophysics An Introductory Textbook For Geologists And Geophysicists
P. 36
in
Depth
Tempsrature
Increase
Increase
+ Shallow =» Rapid
19
&
(°C)
with
System
&
x
Temperature
= Siower —
°
TOD
me
Non-Linear
Lithosphere/Asthenosphere
i
Temperature
°
Gradient
q
2
ieee
=
T
:
b)
= 8
(wy) urdeg
in
Depth
Increase
(MPa)
with
Pressure
Pressure
Linear
=
P
a)
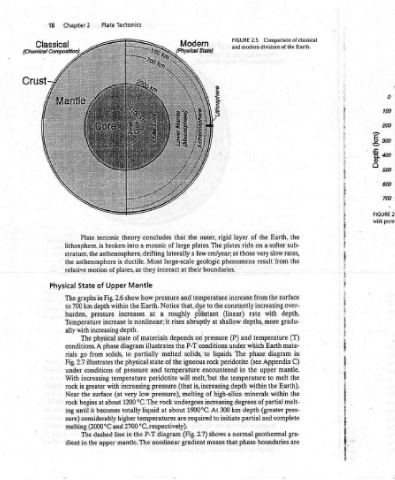
8 i INCTEASE.... :... : 500 and temperature in Pressure 2.6 FIGURE 1987, Physical Geology by Skinner/Porter, © from » Earth’s upper 700 km. Modified with permission of John Wiley and Sons, Inc., New York. crossed, cold is peridotite the km, 100 upper the in (a) regions: distinct three giving the km 350 and 100
(uy) ydeq
i ciao ain Abia AUIS SV INHS. Tncs A ne UB ask tu: Rie sR aaa Orb aa amdie sine ee a RACED Ore ANE I AR Aidt Slo
of classical Earth. the sub- rates, the (T) mate- in C) the the melt- pres- gra- are
Comparison modern divisions of the Earth, softer slow from surface the increasing over- depth. with gradu- more temperature Earth diagram (see Appendix mantle. upper melt to Earth). the within of partial (greater complete and geothermal boundaries
2.5 the of a on very result from rate depths, which phase the temperature within minerals depth partial
FIGURE and layer ride those at phenomena increase constantly (linear) and (P) under The peridotite in depth degrees km normal phase
rigid plates boundaries. the shallow liquids. encountered the high-silica increasing 300 initiate a shows that
outer, The plates. few cm/year; geologic temperature to constant at on pressure P-T conditions. to rock melt, but increasing of At to 2.7) means
the a their and that, due abruptly solids, igneous is, melting undergoes 1900°C. required (Fig. gradient
that large of laterally large-scale at Notice roughly rises depends the melted of the temperature will (that about are diagram
concludes mosaic Most interact they pressure how Earth. a at it nonlinear; materials illustrates partially state and peridotite pressure pressure), low rock at liquid higher temperatures 2700 °C, respectively). P-T nonlinear
Tectonics theory a into asthenosphere, drifting ductile. is of plates, as Mantle show the within increases is depth. of state diagram to physical the pressure of temperature increasing very (at 1200 °C. The totally the in line mantle. The
Plate tectonic broken is the asthenosphere motion Upper of Fig. 2.6 in depth pressure increase increasing physical phase solids, from illustrates conditions increasing with greater surface about at becomes it considerably and (2000 °C dashed upper the
Chapter2 n) Plate lithosphere. stratum, the relative State Physical graphs The km 700 to burden, Temperature with ally The conditions. A go rials Fig. 2.7 under With is rock the Near begins until ing sure) elting The in dient
Res