
Page 37 - Whole Earth Geophysics An Introductory Textbook For Geologists And Geophysicists
P. 37
in 1987,
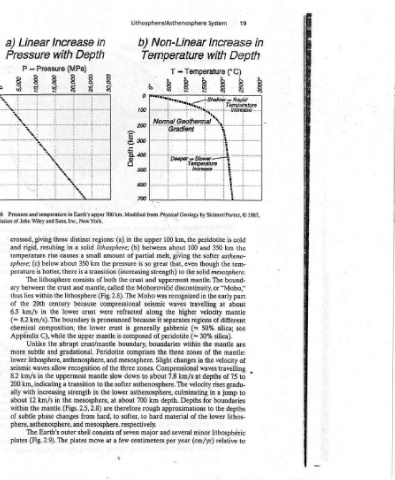
19 Depth (°C) & Tempsrature Increase cold the astheno- tem- bound- “Moho,” part about mantle see are mantle: of travelling to 75 gradu- to depths lithos- to
System Increase with Temperature ° ° + Shallow =» Rapid me x & i i INCTEASE.... Physical Geology by Skinner/Porter, © is peridotite km 350 and the softer the though mesosphere. solid The mantle. or early the in at travelling velocity of different regions silica; 50% (~ silica). 30% (~ mantle the the of zones velocity the in waves of depths at rises
= Siower —
TOD
Lithosphere/Asthenosphere Non-Linear Temperature = T 2 Gradient q : ieee :... : from » the km, 100 upper 100 about between giving melt, even that, great the to strength) uppermost and discontinuity, Mohorovici¢ recognized was waves seismic higher the along separates it gabbroic of peridotite boundaries within three the changes Slight Compressional km/s 7.8 abo
b)
= 8
(wy) urdeg 500 the in (a) (b) of partial pressure so is (increasing crust the the called Moho 2.8). The compressional refracted because generally is crust composed is boundary, comprises mesosphere. zones. three to down slow softer lower 700 about therefore to softer, to mesosphere, respectively. seven of centimeters few
in Depth Earth’s upper 700 km. Modified regions: lithosphere; solid amount small the km transition both of mantle, (Fig. were crust pronounced is lower mantle crust/mantle Peridotite and the of mantle the to the in at mesosphere, are 2.8) hard, from consists move a at
Increase with (MPa) distinct three a i in a causes 350 about is there a consists lithosphere and crust lithosphere the because century lower the boundary the composition; upper the abrupt gradational. asthenosphere, recognition allow uppermost transition a strength the in 2.5, mantle (Figs. changes shell outer plates The
Linear Pressure Pressure = P and temperature in with permission of John Wiley and Sons, Inc., New York. giving resulting rigid, rise temperature below (c) hotter, is perature The between the within lies 20th the in km/s km/s). The 8.2 chemical C), while Appendix the Unlike and subtle lithosphere, waves the in km/s km, indicating increasing with 12 km/s the ph
a) Pressure 2.6 crossed, and sphere; ary thus of 6.5 (= more lower seismic 8.2 200 ally about within of plates
8 FIGURE
(uy) ydeq
i ciao ain Abia AUIS SV INHS. Tncs A ne UB ask tu: Rie sR aaa Orb aa amdie sine ee a RACED Ore ANE I AR Aidt Slo
of classical Earth. the sub- rates, the (T) mate- in C) the the melt- pres- gra- are
Comparison modern divisions of the Earth, softer slow from surface the increasing over- depth. with gradu- more temperature Earth diagram (see Appendix mantle. upper melt to Earth). the within of partial (greater complete and geothermal boundaries
2.5 the of a on very result from rate depths, which phase the temperature within minerals depth partial
FIGURE and layer ride those at phenomena increase constantly (linear) and (P) under The peridotite in depth degrees km normal phase
rigid plates boundaries. the shallow liquids. encountered the high-silica increasing 300 initiate a shows that
outer, The plates. few cm/year; geologic temperature to constant at on pressure P-T conditions. to rock melt, but increasing of At to 2.7) means
the a their and that, due abruptly solids, igneous is, melting undergoes 1900°C. required (Fig. gradient
that large of laterally large-scale at Notice roughly rises depends the melted of the temperature will (that about are diagram
concludes mosaic Most interact they pressure how Earth. a at it nonlinear; materials illustrates partially state and peridotite pressure pressure), low rock at liquid higher temperatures 2700 °C, respectively). P-T nonlinear
Tectonics theory a into asthenosphere, drifting ductile. is of plates, as Mantle show the within increases is depth. of state diagram to physical the pressure of temperature increasing very (at 1200 °C. The totally the in line mantle. The
Plate tectonic broken is the asthenosphere motion Upper of Fig. 2.6 in depth pressure increase increasing physical phase solids, from illustrates conditions increasing with greater surface about at becomes it considerably and (2000 °C dashed upper the
Chapter2 n) Plate lithosphere. stratum, the relative State Physical graphs The km 700 to burden, Temperature with ally The conditions. A go rials Fig. 2.7 under With is rock the Near begins until ing sure) elting The in dient
Res