
Page 413 - Wind Energy Handbook
P. 413
BLADES 387
In the GL rules, the å–N curve for design takes the same form as Equation (7.6)
for the case of reverse loading, but å 0 is set equal to the strain at ultimate tensile
load and partial materials safety factors are included. GL specifies different values
of the index, m, for composites with polyester and epoxy matrixes – 9 and 10
respectively – although opinion is divided as to whether the difference is justified.
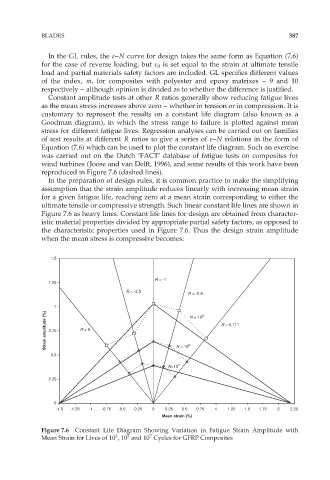
Constant amplitude tests at other R ratios generally show reducing fatigue lives
as the mean stress increases above zero – whether in tension or in compression. It is
customary to represent the results on a constant life diagram (also known as a
Goodman diagram), in which the stress range to failure is plotted against mean
stress for different fatigue lives. Regression analyses can be carried out on families
of test results at different R ratios to give a series of å–N relations in the form of
Equation (7.6) which can be used to plot the constant life diagram. Such an exercise
was carried out on the Dutch ‘FACT’ database of fatigue tests on composites for
wind turbines (Joose and van Delft, 1996), and some results of this work have been
reproduced in Figure 7.6 (dashed lines).
In the preparation of design rules, it is common practice to make the simplifying
assumption that the strain amplitude reduces linearly with increasing mean strain
for a given fatigue life, reaching zero at a mean strain corresponding to either the
ultimate tensile or compressive strength. Such linear constant life lines are shown in
Figure 7.6 as heavy lines. Constant life lines for design are obtained from character-
istic material properties divided by appropriate partial safety factors, as opposed to
the characterisitc properties used in Figure 7.6. Thus the design strain amplitude
when the mean stress is compressive becomes:
1.5
R = -1
1.25
R = -2.5
R = -0.4
1 N = 10 3
Strain amplitude (%) 0.75 R = 9 R = 0.111
0.5 N = 10 5
N=10 7
0.25
0
-1.5 -1.25 -1 -0.75 -0.5 -0.25 0 0.25 0.5 0.75 1 1.25 1.5 1.75 2 2.25
Mean strain (%)
Figure 7.6 Constant Life Diagram Showing Variation in Fatigue Strain Amplitude with
3
5
7
Mean Strain for Lives of 10 ,10 and 10 Cycles for GFRP Composites