
Page 417 - Wind Energy Handbook
P. 417
BLADES 391
the part of the tree from which the wood is taken. Such variability can be reduced
by careful grading and the rejection of damaged veneers before laminating. Bonfield
and Ansell (1991) report compression tests on 32 carefully selected Khaya samples
which yielded the compression strength of 50 MPa given in the table with a
standard deviation of only 3 MPa. It should be noted that the lack of annual growth
rings in equatorially grown wood may reduce the degree of scatter. Wood strengths
perpendicular to the grain are typically much less than those along the grain – for
example, the compressive strength of transversely loaded Khaya is only 12.6 MPa.
Fatigue properties
The fatigue properties of wood laminates have been the subject of a sustained
programme of work at Bath University, starting with Khaya and then extending to
other species (Bonfield et al. (1992)). A useful summary of this work appears in
Bond and Ansell (1998). The general conclusion is that wood performs very well in
fatigue with a shallow S–N curve slope, and that fatigue strengths at high cycles do
not vary greatly between species.
If the S–N curve for constant amplitude, reverse loading (R ¼ 1) fatigue is
normalized with respect to the ultimate compressive strength, ó cu – i.e., ó ¼
ó cu N 1=m , then the results of tests on unjointed Khaya indicate a value of the index
m of about 20. However, the value of m reduces to about 16 for scarf-jointed khaya,
poplar and beech, and to about 13 for butt-jointed specimens. Hancock and Bond
(1995) have proposed the use of an index of 13.4 for design purposes for scarf-
jointed wood laminates in general.
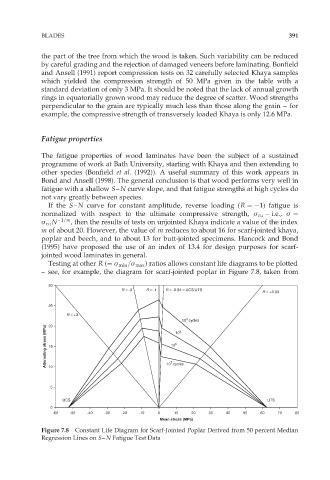
Testing at other R (¼ ó min =ó max ) ratios allows constant life diagrams to be plotted
– see, for example, the diagram for scarf-jointed poplar in Figure 7.8, taken from
30
R = -3 R = -1 R = -0.84 = UCS/UTS
R = +0.33
25
R = +3
4
10 cycles
20
Alternating stress (MPa) 15 10 cycles
5
10
6
10
7
10
5
UCS UTS
0
-60 -50 -40 -30 -20 -10 0 10 20 30 40 50 60 70 80
Mean stress (MPa)
Figure 7.8 Constant Life Diagram for Scarf-Jointed Poplar Derived from 50 percent Median
Regression Lines on S–N Fatigue Test Data