
Page 425 - Wind Energy Handbook
P. 425
BLADES 399
800
700
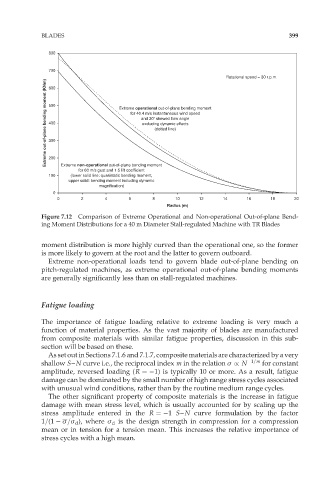
Rotational speed = 30 r.p.m.
Extreme out-of-plane bending moment (KNm) 500 Extreme operational out-of-plane bending moment
600
for 40.4 m/s instantaneous wind speed
and 30 skewed flow angle
400
excluding dynamic effects
(dotted line)
300
200
Extreme non-operational out-of-plane bending moment
for 60 m/s gust and 1.5 lift coefficient
100 (lower solid line: quasistatic bending moment,
upper solid: bending moment including dynamic
magnification)
0
0 2 4 6 8 10 12 14 16 18 20
Radius (m)
Figure 7.12 Comparison of Extreme Operational and Non-operational Out-of-plane Bend-
ing Moment Distributions for a 40 m Diameter Stall-regulated Machine with TR Blades
moment distribution is more highly curved than the operational one, so the former
is more likely to govern at the root and the latter to govern outboard.
Extreme non-operational loads tend to govern blade out-of-plane bending on
pitch-regulated machines, as extreme operational out-of-plane bending moments
are generally significantly less than on stall-regulated machines.
Fatigue loading
The importance of fatigue loading relative to extreme loading is very much a
function of material properties. As the vast majority of blades are manufactured
from composite materials with similar fatigue properties, discussion in this sub-
section will be based on these.
As set out in Sections 7.1.6 and 7.1.7, composite materials are characterized by a very
shallow S–N curve i.e., the reciprocal index m in the relation ó / N 1=m for constant
amplitude, reversed loading (R ¼ 1) is typically 10 or more. As a result, fatigue
damage can be dominated by the small number of high range stress cycles associated
with unusual wind conditions, rather than by the routine medium range cycles.
The other significant property of composite materials is the increase in fatigue
damage with mean stress level, which is usually accounted for by scaling up the
stress amplitude entered in the R ¼ 1 S–N curve formulation by the factor
1=(1 ó=ó d ), where ó d is the design strength in compression for a compression
mean or in tension for a tension mean. This increases the relative importance of
stress cycles with a high mean.