
Page 458 - Wind Energy Handbook
P. 458
432 COMPONENT DESIGN
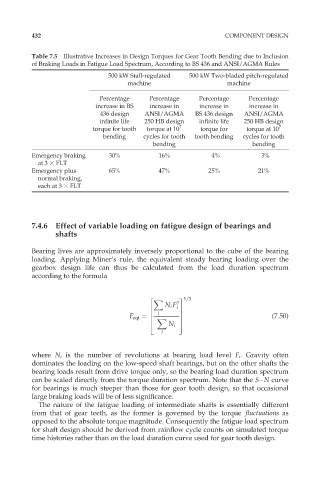
Table 7.5 Illustrative Increases in Design Torques for Gear Tooth Bending due to Inclusion
of Braking Loads in Fatigue Load Spectrum, According to BS 436 and ANSI/AGMA Rules
500 kW Stall-regulated 500 kW Two-bladed pitch-regulated
machine machine
Percentage Percentage Percentage Percentage
increase in BS increase in increase in increase in
436 design ANSI/AGMA BS 436 design ANSI/AGMA
infinite life 250 HB design infinite life 250 HB design
torque for tooth torque at 10 7 torque for torque at 10 7
bending cycles for tooth tooth bending cycles for tooth
bending bending
Emergency braking 30% 16% 4% 3%
at 3 3 FLT
Emergency plus 65% 47% 25% 21%
normal braking,
each at 3 3 FLT
7.4.6 Effect of variable loading on fatigue design of bearings and
shafts
Bearing lives are approximately inversely proportional to the cube of the bearing
loading. Applying Miner’s rule, the equivalent steady bearing loading over the
gearbox design life can thus be calculated from the load duration spectrum
according to the formula
2 X 3 1=3
N i F 3
6 i 7
6
7
i
F eqt ¼ 6 X 7 (7:50)
4 5
N i
i
where N i is the number of revolutions at bearing load level F i . Gravity often
dominates the loading on the low-speed shaft bearings, but on the other shafts the
bearing loads result from drive torque only, so the bearing load duration spectrum
can be scaled directly from the torque duration spectrum. Note that the S–N curve
for bearings is much steeper than those for gear tooth design, so that occasional
large braking loads will be of less significance.
The nature of the fatigue loading of intermediate shafts is essentially different
from that of gear teeth, as the former is governed by the torque fluctuations as
opposed to the absolute torque magnitude. Consequently the fatigue load spectrum
for shaft design should be derived from rainflow cycle counts on simulated torque
time histories rather than on the load duration curve used for gear tooth design.