
Page 110 - Characterization and Properties of Petroleum Fractions - M.R. Riazi
P. 110
T1: IML
QC: IML/FFX
P2: IML/FFX
P1: IML/FFX
AT029-Manual-v7.cls
AT029-Manual
14:23
June 22, 2007
AT029-03
90 CHARACTERIZATION AND PROPERTIES OF PETROLEUM FRACTIONS
gas such as helium or nitrogen. The stationary phase is either
250
solid or liquid. A component that is more strongly attracted to
200 ASTM D86 the mobile phase than to the stationary phase is swept along
with the mobile phase more rapidly than a component that is
SD (ASTM D2887) more strongly attracted to the stationary phase. The mobile
Temperature, °C 150 phase can be a liquid phase as well; in this case the chro-
matography method is called liquid chromatography (LC).
The basic elements of a GC are a cylinder of carrier gas,
100
flow controller and pressure regulator, sample injector, col-
umn, detector, recorder, and thermostats for cylinder, col-
50 umn, and detector. The sample after injection enters a heated
oven where it enters the GC column (stationary phase). The
0 eluted components by the carrier gas called effluents enter
a detector where the concentration of each component may
0 20 40 60 80 100
be determined. The presence of a component in the carrier
Percent Vaporized
gas leaving the column is continuously monitored through
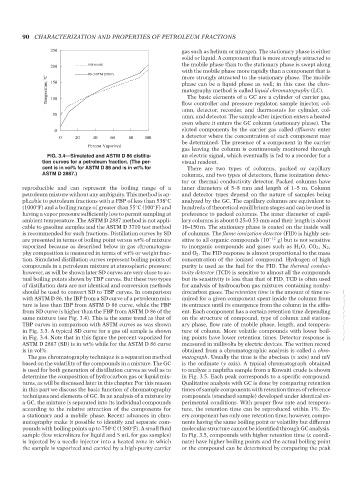
FIG. 3.4—Simulated and ASTM D 86 distilla- an electric signal, which eventually is fed to a recorder for a
tion curves for a petroleum fraction. (The per- visual readout.
cent is in vol% for ASTM D 86 and is in wt% for There are two types of columns, packed or capillary
ASTM D 2887.) columns, and two types of detectors, flame ionization detec-
tor or thermal conductivity detector. Packed columns have
reproducible and can represent the boiling range of a inner diameters of 5–8 mm and length of 1–5 m. Column
petroleum mixture without any ambiguity. This method is ap- and detector types depend on the nature of samples being
plicable to petroleum fractions with a FBP of less than 538 C analyzed by the GC. The capillary columns are equivalent to
◦
(1000 F) and a boiling range of greater than 55 C (100 F) and hundreds of theoretical equilibrium stages and can be used in
◦
◦
◦
having a vapor pressure sufficiently low to permit sampling at preference to packed columns. The inner diameter of capil-
ambient temperature. The ASTM D 2887 method is not appli- lary columns is about 0.25–0.53 mm and their length is about
cable to gasoline samples and the ASTM D 3710 test method 10–150 m. The stationary phase is coated on the inside wall
is recommended for such fractions. Distillation curves by SD of columns. The flame ionization detector (FID) is highly sen-
are presented in terms of boiling point versus wt% of mixture sitive to all organic compounds (10 −12 g) but is not sensitive
vaporized because as described below in gas chromatogra- to inorganic compounds and gases such as H 2 O, CO 2 ,N 2 ,
phy composition is measured in terms of wt% or weight frac- and O 2 . The FID response is almost proportional to the mass
tion. Simulated distillation curves represent boiling points of concentration of the ionized compound. Hydrogen of high
compounds in a petroleum mixture at atmospheric pressure; purity is used as the fuel for the FID. The thermal conduc-
however, as will be shown later SD curves are very close to ac- tivity detector (TCD) is sensitive to almost all the compounds
tual boiling points shown by TBP curves. But these two types but its sensitivity is less than that of FID. TCD is often used
of distillation data are not identical and conversion methods for analysis of hydrocarbon gas mixtures containing nonhy-
should be used to convert SD to TBP curves. In comparison drocarbon gases. The retention time is the amount of time re-
with ASTM D 86, the IBP from a SD curve of a petroleum mix- quired for a given component spent inside the column from
ture is less than IBP from ASTM D 86 curve, while the FBP its entrance until its emergence from the column in the efflu-
from SD curve is higher than the FBP from ASTM D 86 of the ent. Each component has a certain retention time depending
same mixture (see Fig. 3.4). This is the same trend as that of on the structure of compound, type of column and station- --`,```,`,``````,`,````,```,,-`-`,,`,,`,`,,`---
TBP curves in comparison with ASTM curves as was shown ary phase, flow rate of mobile phase, length, and tempera-
in Fig. 3.3. A typical SD curve for a gas oil sample is shown ture of column. More volatile compounds with lower boil-
in Fig. 3.4. Note that in this figure the percent vaporized for ing points have lower retention times. Detector response is
ASTM D 2887 (SD) is in wt% while for the ASTM D 86 curve measured in millivolts by electric devices. The written record
is in vol%. obtained from a chromatographic analysis is called a chro-
The gas chromatography technique is a separation method matograph. Usually the time is the abscissa (x axis) and mV
based on the volatility of the compounds in a mixture. The GC is the ordinate (y axis). A typical chromatograph obtained
is used for both generation of distillation curves as well as to to analyze a naphtha sample from a Kuwaiti crude is shown
determine the composition of hydrocarbon gas or liquid mix- in Fig. 3.5. Each peak corresponds to a specific compound.
tures, as will be discussed later in this chapter. For this reason Qualitative analysis with GC is done by comparing retention
in this part we discuss the basic function of chromatography times of sample components with retention times of reference
techniques and elements of GC. In an analysis of a mixture by compounds (standard sample) developed under identical ex-
a GC, the mixture is separated into its individual compounds perimental conditions. With proper flow rate and tempera-
according to the relative attraction of the components for ture, the retention time can be reproduced within 1%. Ev-
a stationary and a mobile phase. Recent advances in chro- ery component has only one retention time; however, compo-
matography make it possible to identify and separate com- nents having the same boiling point or volatility but different
pounds with boiling points up to 750 C (1380 F). A small fluid molecular structure cannot be identified through GC analysis.
◦
◦
sample (few microliters for liquid and 5 mL for gas samples) In Fig. 3.5, compounds with higher retention time (x coordi-
is injected by a needle injector into a heated zone in which nate) have higher boiling points and the actual boiling point
the sample is vaporized and carried by a high-purity carrier or the compound can be determined by comparing the peak
Copyright ASTM International
Provided by IHS Markit under license with ASTM Licensee=International Dealers Demo/2222333001, User=Anggiansah, Erick
No reproduction or networking permitted without license from IHS Not for Resale, 08/26/2021 21:56:35 MDT