
Page 108 - Characterization and Properties of Petroleum Fractions - M.R. Riazi
P. 108
T1: IML
P2: IML/FFX
P1: IML/FFX
QC: IML/FFX
14:23
June 22, 2007
AT029-Manual
AT029-03
AT029-Manual-v7.cls
88 CHARACTERIZATION AND PROPERTIES OF PETROLEUM FRACTIONS
IN THIS CHAPTER methods of characterization of petroleum
fractions and products are discussed. Petroleum fractions are 330
mixtures of hydrocarbon compounds with a limited boiling Gas Oil
point range. Experimental methods on measurement of ba- 320 n-Tetradecane
sic properties that can be obtained from laboratory testing are
first presented and then methods of prediction of properties 310 n-Hexadecane
that are not available will be discussed. Two general meth- n-Nonadecane
ods are presented: one for defined mixtures and another for 300
undefined mixtures in which the composition is not known Temperature, C
but some bulk properties are available. Petroleum fractions 290
are also divided into light and heavy as well as narrow and
wide boiling range mixtures in which different characteriza- 280
tion methods are proposed. In addition to methods of estima-
tion of characterization parameters discussed in Chapter 2 270
for pure hydrocarbons, predictive methods for some char-
acteristics specifically applicable to petroleum fractions are 260
presented in this chapter. These characteristic parameters in-
clude distillation curve types and their interconversions, hy- 250
drocarbon type composition, sulfur content, carbon residue, 0 20 40 60 80 100
octane number, pour, cloud, aniline, and smoke points that af- Vol% Vaporized
fect the quality of a fuel. Standard test methods recommended
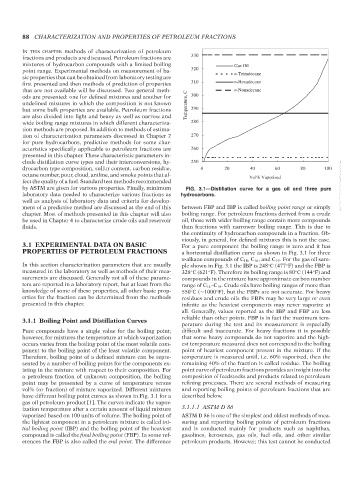
by ASTM are given for various properties. Finally, minimum FIG. 3.1—Distillation curve for a gas oil and three pure --`,```,`,``````,`,````,```,,-`-`,,`,,`,`,,`---
laboratory data needed to characterize various fractions as hydrocarbons.
well as analysis of laboratory data and criteria for develop-
ment of a predictive method are discussed at the end of this between FBP and IBP is called boiling point range or simply
chapter. Most of methods presented in this chapter will also boiling range. For petroleum fractions derived from a crude
be used in Chapter 4 to characterize crude oils and reservoir oil, those with wider boiling range contain more compounds
fluids. than fractions with narrower boiling range. This is due to
the continuity of hydrocarbon compounds in a fraction. Ob-
viously, in general, for defined mixtures this is not the case.
3.1 EXPERIMENTAL DATA ON BASIC For a pure component the boiling range is zero and it has
PROPERTIES OF PETROLEUM FRACTIONS a horizontal distillation curve as shown in Fig. 3.1 for three
n-alkane compounds of C 14 ,C 16 , and C 19 . For the gas oil sam-
In this section characterization parameters that are usually ple shown in Fig. 3.1 the IBP is 248 C (477 F) and the FBP is
◦
◦
measured in the laboratory as well as methods of their mea- 328 C (621 F). Therefore its boiling range is 80 C (144 F) and
◦
◦
◦
◦
surements are discussed. Generally not all of these parame- compounds in the mixture have approximate carbon number
ters are reported in a laboratory report, but at least from the range of C 14 –C 19 . Crude oils have boiling ranges of more than
knowledge of some of these properties, all other basic prop- 550 C(∼1000 F), but the FBPs are not accurate. For heavy
◦
◦
erties for the fraction can be determined from the methods residues and crude oils the FBPs may be very large or even
presented in this chapter. infinite as the heaviest components may never vaporize at
all. Generally, values reported as the IBP and FBP are less
reliable than other points. FBP is in fact the maximum tem-
3.1.1 Boiling Point and Distillation Curves
perature during the test and its measurement is especially
Pure compounds have a single value for the boiling point; difficult and inaccurate. For heavy fractions it is possible
however, for mixtures the temperature at which vaporization that some heavy compounds do not vaporize and the high-
occurs varies from the boiling point of the most volatile com- est temperature measured does not correspond to the boiling
ponent to the boiling point of the least volatile component. point of heaviest component present in the mixture. If the
Therefore, boiling point of a defined mixture can be repre- temperature is measured until, i.e. 60% vaporized, then the
sented by a number of boiling points for the components ex- remaining 40% of the fraction is called residue. The boiling
isting in the mixture with respect to their composition. For point curve of petroleum fractions provides an insight into the
a petroleum fraction of unknown composition, the boiling composition of feedstocks and products related to petroleum
point may be presented by a curve of temperature versus refining processes. There are several methods of measuring
vol% (or fraction) of mixture vaporized. Different mixtures and reporting boiling points of petroleum fractions that are
have different boiling point curves as shown in Fig. 3.1 for a described below.
gas oil petroleum product [1]. The curves indicate the vapor-
ization temperature after a certain amount of liquid mixture 3.1.1.1 ASTM D 86
vaporized based on 100 units of volume. The boiling point of ASTM D 86 is one of the simplest and oldest methods of mea-
the lightest component in a petroleum mixture is called ini- suring and reporting boiling points of petroleum fractions
tial boiling point (IBP) and the boiling point of the heaviest and is conducted mainly for products such as naphthas,
compound is called the final boiling point (FBP). In some ref- gasolines, kerosenes, gas oils, fuel oils, and other similar
erences the FBP is also called the end point. The difference petroleum products. However, this test cannot be conducted
Copyright ASTM International
Provided by IHS Markit under license with ASTM Licensee=International Dealers Demo/2222333001, User=Anggiansah, Erick
No reproduction or networking permitted without license from IHS Not for Resale, 08/26/2021 21:56:35 MDT