
Page 109 - Characterization and Properties of Petroleum Fractions - M.R. Riazi
P. 109
T1: IML
P2: IML/FFX
P1: IML/FFX
QC: IML/FFX
June 22, 2007
AT029-Manual-v7.cls
14:23
AT029-03
AT029-Manual
3. CHARACTERIZATION OF PETROLEUM FRACTIONS 89
--`,```,`,``````,`,````,```,,-`-`,,`,,`,`,,`---
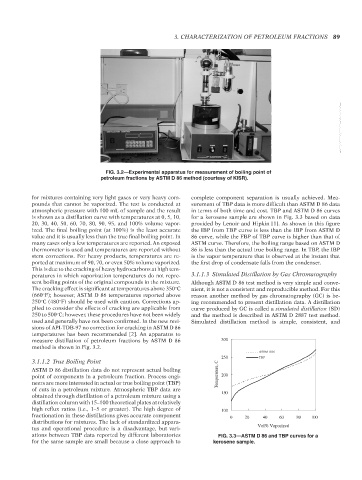
FIG. 3.2—Experimental apparatus for measurement of boiling point of
petroleum fractions by ASTM D 86 method (courtesy of KISR).
for mixtures containing very light gases or very heavy com- complete component separation is usually achieved. Mea-
pounds that cannot be vaporized. The test is conducted at surement of TBP data is more difficult than ASTM D 86 data
atmospheric pressure with 100 mL of sample and the result in terms of both time and cost. TBP and ASTM D 86 curves
is shown as a distillation curve with temperatures at 0, 5, 10, for a kerosene sample are shown in Fig. 3.3 based on data
20, 30, 40, 50, 60, 70, 80, 90, 95, and 100% volume vapor- provided by Lenoir and Hipkin [1]. As shown in this figure
ized. The final boiling point (at 100%) is the least accurate the IBP from TBP curve is less than the IBP from ASTM D
value and it is usually less than the true final boiling point. In 86 curve, while the FBP of TBP curve is higher than that of
many cases only a few temperatures are reported. An exposed ASTM curve. Therefore, the boiling range based on ASTM D
thermometer is used and temperatures are reported without 86 is less than the actual true boiling range. In TBP, the IBP
stem corrections. For heavy products, temperatures are re- is the vapor temperature that is observed at the instant that
ported at maximum of 90, 70, or even 50% volume vaporized. the first drop of condensate falls from the condenser.
This is due to the cracking of heavy hydrocarbons at high tem-
peratures in which vaporization temperatures do not repre- 3.1.1.3 Simulated Distillation by Gas Chromatography
sent boiling points of the original compounds in the mixture. Although ASTM D 86 test method is very simple and conve-
The cracking effect is significant at temperatures above 350 C nient, it is not a consistent and reproducible method. For this
◦
(660 F); however, ASTM D 86 temperatures reported above reason another method by gas chromatography (GC) is be-
◦
250 C (480 F) should be used with caution. Corrections ap- ing recommended to present distillation data. A distillation
◦
◦
plied to consider the effects of cracking are applicable from curve produced by GC is called a simulated distillation (SD)
250 to 500 C; however, these procedures have not been widely and the method is described in ASTM D 2887 test method.
◦
used and generally have not been confirmed. In the new revi- Simulated distillation method is simple, consistent, and
sions of API-TDB-97 no correction for cracking in ASTM D 86
temperatures has been recommended [2]. An apparatus to
measure distillation of petroleum fractions by ASTM D 86 300
method is shown in Fig. 3.2.
ASTM D86
250 TBP
3.1.1.2 True Boiling Point
ASTM D 86 distillation data do not represent actual boiling
point of components in a petroleum fraction. Process engi- Temperature, C 200
neers are more interested in actual or true boiling point (TBP)
of cuts in a petroleum mixture. Atmospheric TBP data are
obtained through distillation of a petroleum mixture using a 150
distillation column with 15–100 theoretical plates at relatively
high reflux ratios (i.e., 1–5 or greater). The high degree of 100
fractionation in these distillations gives accurate component 0 20 40 60 80 100
distributions for mixtures. The lack of standardized appara-
tus and operational procedure is a disadvantage, but vari- Vol% Vaporized
ations between TBP data reported by different laboratories FIG. 3.3—ASTM D 86 and TBP curves for a
for the same sample are small because a close approach to kerosene sample.
Copyright ASTM International
Provided by IHS Markit under license with ASTM Licensee=International Dealers Demo/2222333001, User=Anggiansah, Erick
No reproduction or networking permitted without license from IHS Not for Resale, 08/26/2021 21:56:35 MDT