
Page 111 - Characterization and Properties of Petroleum Fractions - M.R. Riazi
P. 111
T1: IML
QC: IML/FFX
P2: IML/FFX
P1: IML/FFX
AT029-Manual-v7.cls
June 22, 2007
14:23
AT029-Manual
AT029-03
3. CHARACTERIZATION OF PETROLEUM FRACTIONS 91
--`,```,`,``````,`,````,```,,-`-`,,`,,`,`,,`---
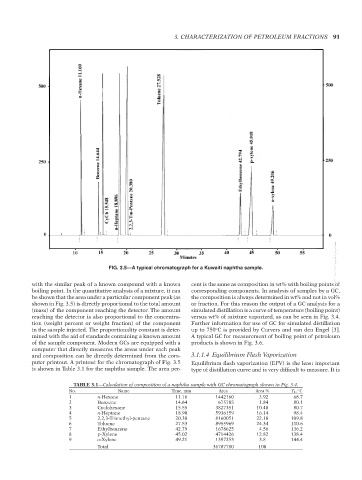
FIG. 3.5—A typical chromatograph for a Kuwaiti naphtha sample.
with the similar peak of a known compound with a known cent is the same as composition in wt% with boiling points of
boiling point. In the quantitative analysis of a mixture, it can corresponding components. In analysis of samples by a GC,
be shown that the area under a particular component peak (as the composition is always determined in wt% and not in vol%
shown in Fig. 3.5) is directly proportional to the total amount or fraction. For this reason the output of a GC analysis for a
(mass) of the component reaching the detector. The amount simulated distillation is a curve of temperature (boiling point)
reaching the detector is also proportional to the concentra- versus wt% of mixture vaporized, as can be seen in Fig. 3.4.
tion (weight percent or weight fraction) of the component Further information for use of GC for simulated distillation
in the sample injected. The proportionality constant is deter- up to 750 C is provided by Curvers and van den Engel [3].
◦
mined with the aid of standards containing a known amount A typical GC for measurement of boiling point of petroleum
of the sample component. Modern GCs are equipped with a products is shown in Fig. 3.6.
computer that directly measures the areas under each peak
and composition can be directly determined from the com- 3.1.1.4 Equilibrium Flash Vaporization
puter printout. A printout for the chromatograph of Fig. 3.5 Equilibrium flash vaporization (EFV) is the least important
is shown in Table 3.1 for the naphtha sample. The area per- type of distillation curve and is very difficult to measure. It is
TABLE 3.1—Calculation of composition of a naphtha sample with GC chromatograph shown in Fig. 3.4.
No. Name Time, min Area Area % T b , C
◦
1 n-Hexane 11.16 1442160 3.92 68.7
2 Benzene 14.64 675785 1.84 80.1
3 Cyclohexane 15.55 3827351 10.40 80.7
4 n-Heptane 18.90 5936159 16.14 98.4
5 2,2,3-Trimethyl-pentane 20.38 8160051 22.18 109.8
6 Toluene 27.53 8955969 24.34 110.6
7 Ethylbenzene 42.79 1678625 4.56 136.2
8 p-Xylene 45.02 4714426 12.82 138.4
9 o-Xylene 49.21 1397253 3.8 144.4
Total 36787780 100
Copyright ASTM International
Provided by IHS Markit under license with ASTM Licensee=International Dealers Demo/2222333001, User=Anggiansah, Erick
No reproduction or networking permitted without license from IHS Not for Resale, 08/26/2021 21:56:35 MDT