
Page 183 - Characterization and Properties of Petroleum Fractions - M.R. Riazi
P. 183
P2: KVU/KXT
T1: IML
QC: —/—
P1: KVU/KXT
June 22, 2007
21:30
AT029-Manual-v7.cls
AT029-Manual
AT029-04
4. CHARACTERIZATION OF RESERVOIR FLUIDS AND CRUDE OILS 163
Values of critical properties and acentric factor for SCN
groups greater than C 30 estimated by different methods vary correlations and d c is calculated from Eq. (2.98). Actual val-
ues of ω are probably greater than those given in this table.
significantly especially for higher SCN groups. Reliability of Values of Z c calculated from its definition by Eq. (2.8) for C 60 ,
these values is subject to further research and no concrete C 70 , and C 80 are 0.141, 0.132, and 0.125, respectively.
recommendation is given in the literature.
Values of M given in Table 4.6 are more consistent with
values of M recommended by Pedersen et al. [6] than those 4.4 CHARACTERIZATION APPROACHES
suggested by Whitson [15] as discussed by Riazi et al. [16]. FOR C 7+ FRACTIONS
Molecular weights of SCN groups recommended by Whitson
[15] are based on the Katz–Firoozabadi values. However, In description of composition of a reservoir fluid, C 6 is a very
more recently Whitson [17] recommends values of M for SCN narrow boiling range fraction and characterization methods
groups, which are very close to those suggested by Riazi [16]. discussed in Chapter 2 (i.e., Eq. 2.38 [17]) can be used to esti-
Although he refers to Katz–Firrozabadi molecular weights, mate various properties of this group. Contrary to C 6 group,
his reported values are much higher than those given in Ref. the C 7+ fraction has a very wide boiling range especially for
[14]. In addition the Watson characterization factor (K W ) re- crude oils. Therefore, methods of Chapter 2 or 3 cannot be di-
ported in Ref. [15] from C 6 to C 45 should be considered with rectly applied to a C 7+ fraction. However, for a natural gas that
caution as they are nearly constant at 12 while toward heavier its C 7+ fraction has a narrow boiling range and the amount
hydrocarbon factions as the amount of aromatics increases, of C 7+ is quite small, equations such as Eq. (2.40) in terms
the K W values should decrease. Values of properties of SCN of M and SG may be used to estimate various properties. In
groups given in Table 4.6 or those given in Ref. [15] are ap- some references there are specific correlations for properties
proximate as these properties may vary for one fluid mixture of C 7+ fractions. For example, Pedersen et al. [6] suggested
to another. As shown in Table 4.1, values of M for the SCN use of the following relation for calculation of critical volume
of C 7 in four different reservoir fluids vary from 92 to 100. of C 7+ fractions in terms of M 7+ and SG 7+ :
In Table 4.2, molecular weight of each SCN fraction is deter- V c7+ = 0.3456 + 2.4224 × 10 −4
mined by adding 14 to molecular weight of preceding SCN −3 M 7+ − 0.443SG 7+
group [7]. Thus M for C 6 is specified as 86, which is deter- (4.11) + 1.131 × 10 M 7+ SG 7+
mined by adding 14 to molecular weight nC 5 that is 72. The where V c7+ is the critical volume of C 7+ fraction in cm /gmol.
3
Pedersen molecular weight of SCN groups is given in terms Standing represented the graphical correlation of Katz for the
of N C by the following relation [6]: pseudocritical temperature and pressure of C 7+ fractions into
--`,```,`,``````,`,````,```,,-`-`,,`,,`,`,,`---
(4.10) M = 14N C − 4 the following analytical correlations [18]:
T c7+ = 338 + 202 × log(M 7+ − 71.2)
In very few references the value of 2 is used instead of 4
in Eq. (4.10). To obtain properties of heavier SCN groups (4.12) + (1361 × log M 7+ − 2111) log SG 7+
(N C > 50), Eq. (4.7) should be used with coefficients given in P c7+ = 81.91 − 29.7 × log(M 7+ − 61.1) + (SG 7+ − 0.8)
Table 4.5. However, to use this equation, it is necessary to
calculate the molecular weight from boiling point through (4.13) × [159.9 − 58.7 × log(M 7+ − 53.7)]
reversed form of Eq. (4.7). T b is calculated by Eq. (4.8) using where T c7+ and P c7+ are in K and bar, respectively. The origi-
the carbon number. The calculation method is demonstrated nal development of these correlations goes back to the early
in Example 4.2. 1940s and there is no information on the reliability of these
equations. Use of such relations to a C 7+ fraction as a sin-
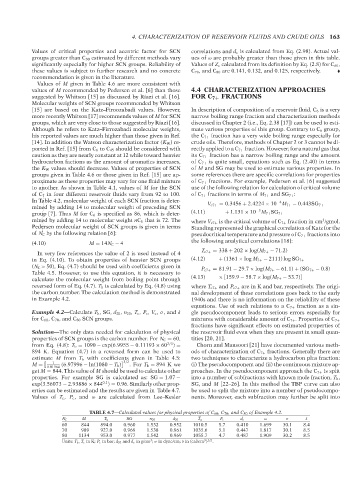
Example 4.2—Calculate T b , SG, d 20 , n 20 , T c , P c , V c , σ, and δ gle pseudocomponent leads to serious errors especially for
for C 60 ,C 70 , and C 80 SCN groups. mixtures with considerable amount of C 7+ . Properties of C 7+
fractions have significant effects on estimated properties of
Solution—The only data needed for calculation of physical the reservoir fluid even when they are present in small quan-
properties of SCN groups is the carbon number. For N C = 60, tities [20, 21].
from Eq. (4.8): T b = 1090 − exp(6.9955 − 0.11193 × 60 2/3 ) = Chorn and Mansoori [21] have documented various meth-
894 K. Equation (4.7) in a reversed form can be used to ods of characterization of C 7+ fractions. Generally there are
estimate M from T b with coefficients given in Table 4.5: two techniques to characterize a hydrocarbon plus fraction:
1
3/2
M = (6.97996 − ln(1080 − T b) . For T b = 894 K we (i) The pseudocomponent and (ii) the continuous mixture ap-
0.01964
get M = 844. This value of M should be used to calculate other proaches. In the pseudocomponent approach the C 7+ is split
properties. For example SG is calculated as: SG = 1.07 − into a number of subfractions with known mole fraction, T b ,
0.1
exp(3.56073 − 2.93886 × 844 ) = 0.96. Similarly other prop- SG, and M [22–26]. In this method the TBP curve can also
erties can be estimated and the results are given in Table 4.7. be used to split the mixture into a number of pseudocompo-
Values of T c , P c , and ω are calculated from Lee–Kesler nents. Moreover, each subfraction may further be split into
TABLE 4.7—Calculated values for physical properties of C 60 ,C 70 , and C 80 of Example 4.2.
N C M T b SG n 20 d 20 T c P c d c ω σ δ
60 844 894.0 0.960 1.532 0.952 1010.5 5.7 0.410 1.699 30.1 8.4
70 989 927.0 0.969 1.538 0.961 1035.6 5.1 0.447 1.817 30.1 8.5
80 1134 953.0 0.977 1.542 0.969 1055.7 4.7 0.487 1.909 30.2 8.5
3
3 1/2
Units: T b , T c in K; P c in bar; d 20 and d c in g/cm ; σ in dyne/cm; δ in (cal/cm ) .
Copyright ASTM International
Provided by IHS Markit under license with ASTM Licensee=International Dealers Demo/2222333001, User=Anggiansah, Erick
No reproduction or networking permitted without license from IHS Not for Resale, 08/26/2021 21:56:35 MDT