
Page 186 - Characterization and Properties of Petroleum Fractions - M.R. Riazi
P. 186
P2: KVU/KXT
QC: —/—
P1: KVU/KXT
June 22, 2007
AT029-Manual-v7.cls
AT029-Manual
AT029-04
166 CHARACTERIZATION AND PROPERTIES OF PETROLEUM FRACTIONS
F(P) T1: IML 21:30
°
P0 P1 P2
P
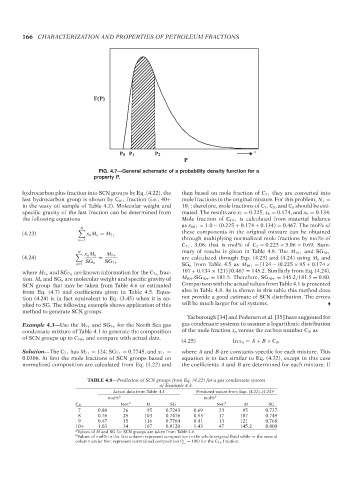
FIG. 4.7—General schematic of a probability density function for a
property P.
hydrocarbon plus fraction into SCN groups by Eq. (4.22), the then based on mole fraction of C 7+ they are converted into
last hydrocarbon group is shown by C N+ fraction (i.e., 40+ mole fractions in the original mixture. For this problem, N + =
in the waxy oil sample of Table 4.2). Molecular weight and 10 + ; therefore, mole fractions of C 7 ,C 8 , and C 9 should be esti-
specific gravity of the last fraction can be determined from mated. The results are x 7 = 0.225, x 8 = 0.174, and x 9 = 0.134.
the following equations Mole fraction of C 10+ is calculated from material balance
as x 10+ = 1.0 − (0.225 + 0.174 + 0.134) = 0.467. The mol% of
N
these components in the original mixture can be obtained
(4.23) x n M n = M 7+
n=7 through multiplying normalized mole fractions by mol% of
C 7+ , 3.06; that is mol% of C 7 = 0.225 × 3.06 = 0.69. Sum-
N mary of results is given in Table 4.8. The M 10+ and SG 10+
x n M n M 7+
(4.24) = are calculated through Eqs. (4.23) and (4.24) using M n and
SG n SG 7+
n=7 SG n from Table 4.5 as M 10+ = [124 − (0.225 × 95 + 0.174 ×
where M 7+ and SG 7+ are known information for the C 7+ frac- 107 + 0.134 × 121)]/0.467 = 145.2. Similarly from Eq. (4.24),
tion. M n and SG n are molecular weight and specific gravity of M 10+ /SG 10+ = 181.5. Therefore, SG 10+ = 145.2/181.5 = 0.80.
SCN group that may be taken from Table 4.6 or estimated Comparison with the actual values from Table 4.1 is presented
from Eq. (4.7) and coefficients given in Table 4.5. Equa- also in Table 4.8. As is shown in this table this method does
tion (4.24) is in fact equivalent to Eq. (3.45) when it is ap- not provide a good estimate of SCN distribution. The errors
plied to SG. The following example shows application of this will be much larger for oil systems.
method to generate SCN groups.
Yarborough [34] and Pedersen et al. [35] have suggested for
Example 4.3—Use the M 7+ and SG 7+ for the North Sea gas gas condensate systems to assume a logarithmic distribution
condensate mixture of Table 4.1 to generate the composition of the mole fraction x n versus the carbon number C N as
of SCN groups up to C 10+ and compare with actual data.
(4.25) ln x n = A + B × C N
Solution—The C 7+ has M 7+ = 124, SG 7+ = 0.7745, and x 7+ = where A and B are constants specific for each mixture. This
0.0306. At first the mole fractions of SCN groups based on equation is in fact similar to Eq. (4.22), except in this case
normalized composition are calculated from Eq. (4.22) and the coefficients A and B are determined for each mixture. If
TABLE 4.8—Prediction of SCN groups from Eq. (4.22) for a gas condensate system
of Example 4.3.
Actual data from Table 4.1 Predicted values from Eqs. (4.22)–(4.24) a
mol% b mol% b
C N Nor. b M SG Nor. b M SG
7 0.80 26 95 0.7243 0.69 23 95 0.727
8 0.76 25 103 0.7476 0.53 17 107 0.749
9 0.47 15 116 0.7764 0.41 13 121 0.768
10+ 1.03 34 167 0.8120 1.43 47 145.2 0.800
a Values of M and SG for SCN groups are taken from Table 4.6.
b Values of mol% in the first column represent composition in the whole original fluid while in the second
column under Nor. represent normalized composition ( = 100) for the C 7+ fraction.
--`,```,`,``````,`,````,```,,-`-`,,`,,`,`,,`---
Copyright ASTM International
Provided by IHS Markit under license with ASTM Licensee=International Dealers Demo/2222333001, User=Anggiansah, Erick
No reproduction or networking permitted without license from IHS Not for Resale, 08/26/2021 21:56:35 MDT