
Page 184 - Characterization and Properties of Petroleum Fractions - M.R. Riazi
P. 184
T1: IML
P2: KVU/KXT
P1: KVU/KXT
QC: —/—
June 22, 2007
AT029-Manual-v7.cls
21:30
AT029-04
AT029-Manual
164 CHARACTERIZATION AND PROPERTIES OF PETROLEUM FRACTIONS
three pseudocomponents from paraffinic, naphthenic, and
numbers to describe the mixture properly. A mathematical
aromatic groups. Although a higher number of pseudocom- plus fraction, it is important to know distribution of carbon
ponents leads to more accurate results, the increase in the function that describes intensity of amount of a carbon num-
number of components complicates the calculations as the ber, or value of molecular weight, or boiling point for com-
number of input data required increases significantly. For pounds with N C ≥ 6 is referred as probability density function
example, the application of a two-parameter equation of state (PDF). The PDF can be obtained from a distribution function
(such as Peng–Robinson EOS) requires four input parame- that describes how various components or their properties
ters for each component: T c , P c , ω, and a binary interaction are distributed in a mixture. In this section, general char-
coefficient (k ij ), which is a correction factor for a mixture of acteristics of density functions are discussed and then three
dissimilar components. The number of variables needed for different distribution models used to describe properties of
a 20-component mixture in two-parameter EOS calculations hydrocarbon-plus fractions are presented.
is 290! [27].
The second approach is the continuous mixture character-
ization method. In this method instead of mole fractions, a 4.5.1 General Characteristics
distribution function is introduced to describe the composi-
tion of many component mixtures [24, 25, 28–32]. Since com- Distribution functions can be applied to determine distribu-
position of a reservoir fluid up to C 5 is given in terms of dis- tion of compounds from hexane or heavier in a reservoir fluid.
crete mole fractions, application of this approach to reservoir However, since the mole fraction of C 6 fraction in reservoir
fluids is also referred as semicontinuous approach in which fluid is usually known and heavier hydrocarbons are grouped
the distribution function is applied to C 6+ part of the mixture. in a C 7+ group, distribution functions are generally used to de-
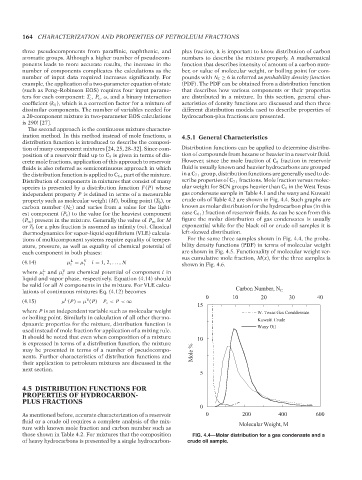
Distribution of components in mixtures that consist of many scribe properties of C 7+ fractions. Mole fraction versus molec-
species is presented by a distribution function F(P) whose ular weight for SCN groups heavier than C 6 in the West Texas
independent property P is defined in terms of a measurable gas condensate sample in Table 4.1 and the waxy and Kuwaiti
property such as molecular weight (M), boiling point (T b ), or crude oils of Table 4.2 are shown in Fig. 4.4. Such graphs are
carbon number (N C ) and varies from a value for the light- known as molar distribution for the hydrocarbon plus (in this
est component (P o ) to the value for the heaviest component case C 6+ ) fraction of reservoir fluids. As can be seen from this
(P ∞ ) present in the mixture. Generally the value of P ∞ for M figure the molar distribution of gas condensates is usually
or T b for a plus fraction is assumed as infinity (∞). Classical exponential while for the black oil or crude oil samples it is
thermodynamics for vapor–liquid equilibrium (VLE) calcula- left-skewed distribution.
tions of multicomponent systems require equality of temper- For the same three samples shown in Fig. 4.4, the proba-
ature, pressure, as well as equality of chemical potential of bility density functions (PDF) in terms of molecular weight
each component in both phases: are shown in Fig. 4.5. Functionality of molecular weight ver-
sus cumulative mole fraction, M(x), for the three samples is
L
(4.14) μ = μ V i = 1, 2, ... , N
i i shown in Fig. 4.6.
V
L
where μ and μ are chemical potential of component i in
i
i
liquid and vapor phase, respectively. Equation (4.14) should
be valid for all N components in the mixture. For VLE calcu-
lations of continuous mixtures Eq. (4.12) becomes Carbon Number, N C
0 10 20 30 40
L
V
(4.15) μ (P) = μ (P) P ◦ < P < ∞
15
where P is an independent variable such as molecular weight W. Texas Gas Conddensate
or boiling point. Similarly in calculation of all other thermo- Kuwaiti Crude
dynamic properties for the mixture, distribution function is Waxy Oil
used instead of mole fraction for application of a mixing rule.
It should be noted that even when composition of a mixture 10
is expressed in terms of a distribution function, the mixture
may be presented in terms of a number of pseudocompo- Mole %
nents. Further characteristics of distribution functions and
their application to petroleum mixtures are discussed in the
next section.
5
4.5 DISTRIBUTION FUNCTIONS FOR
PROPERTIES OF HYDROCARBON-
PLUS FRACTIONS
0
As mentioned before, accurate characterization of a reservoir 0 200 400 600
fluid or a crude oil requires a complete analysis of the mix- Molecular Weight, M
ture with known mole fraction and carbon number such as
those shown in Table 4.2. For mixtures that the composition FIG. 4.4—Molar distribution for a gas condensate and a
of heavy hydrocarbons is presented by a single hydrocarbon- crude oil sample.
Copyright ASTM International
Provided by IHS Markit under license with ASTM Licensee=International Dealers Demo/2222333001, User=Anggiansah, Erick
No reproduction or networking permitted without license from IHS Not for Resale, 08/26/2021 21:56:35 MDT
--`,```,`,``````,`,````,```,,-`-`,,`,,`,`,,`---