
Page 361 - Characterization and Properties of Petroleum Fractions - M.R. Riazi
P. 361
P1: JDW
June 22, 2007
AT029-Manual
14:25
AT029-08
AT029-Manual-v7.cls
8. APPLICATIONS: ESTIMATION OF TRANSPORT PROPERTIES 341
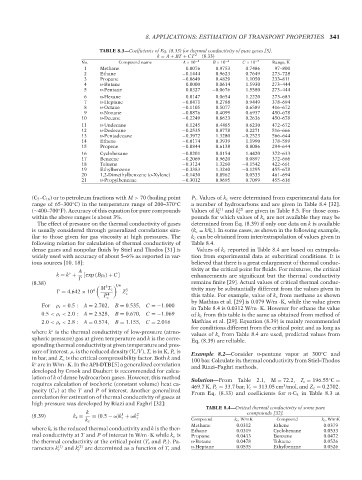
TABLE 8.3—Coefficients of Eq. (8.33) for thermal conductivity of pure gases [5].
k = A + BT + CT 2 (8.33)
No. Compound name A × 10 −1 B × 10 −4 C × 10 −7 Range, K
1 Methane −0.0076 0.9753 0.7486 97–800
2 Ethane −0.1444 0.9623 0.7649 273–728
3 Propane −0.0649 0.4829 1.1050 233–811
4 n-Butane 0.0000 0.0614 1.5930 273–444
5 n-Pentane 0.0327 −0.0676 1.5580 273–444
6 n-Hexane 0.0147 0.0654 1.2220 273–683
7 n-Heptane −0.0471 0.2788 0.9449 378–694
8 n-Octane −0.1105 0.5077 0.6589 416–672
9 n-Nonane −0.0876 0.4099 0.6937 450–678
10 n-Decane −0.2249 0.8623 0.2636 450–678
11 n-Undecane −0.1245 0.4485 0.6230 472–672
12 n-Dodecane −0.2535 0.8778 0.2271 516–666
13 n-Pentadecane −0.3972 1.3280 −0.2523 566–644
14 Ethene −0.0174 0.3939 1.1990 178–589
15 Propene −0.0844 0.6138 0.8086 294–644
16 Cyclohexane −0.0201 0.0154 1.4420 372–633
17 Benzene −0.2069 0.9620 0.0897 372–666
18 Toluene −0.3124 1.3260 −0.1542 422–661
19 Ethylbenzene −0.3383 1.3240 −0.1295 455–678
20 1,2-Dimethylbenzene (o-Xylene) −0.1430 0.8962 0.0533 461–694
21 n-Propylbenzene −0.3012 0.9695 0.7099 455–616
(C 5 –C 16 ) or to petroleum fractions with M > 70 (boiling point P r . Values of k c were determined from experimental data for
range of 65–300 C) in the temperature range of 200–370 C a number of hydrocarbons and are given in Table 8.4 [32].
◦
◦
(∼400–700 F). Accuracy of this equation for pure compounds Values of k (1) and k (2) are given in Table 8.5. For those com-
◦
r r
within the above ranges is about 3%. pounds for which values of k c are not available they may be
The effect of pressure on the thermal conductivity of gases determined from Eq. (8.39) if only one data on k is available
is usually considered through generalized correlations sim- (k c = k/k r ). In some cases, as shown in the following example,
ilar to those given for gas viscosity at high pressures. The k c can be obtained from inter/extrapolation of values given in
following relation for calculation of thermal conductivity of Table 8.4.
dense gases and nonpolar fluids by Stiel and Thodos [31] is Values of k c reported in Table 8.4 are based on extrapola-
widely used with accuracy of about 5–6% as reported in var- tion from experimental data at subcritical conditions. It is
ious sources [10, 18]: believed that there is a great enlargement of thermal conduc-
A tivity at the critical point for fluids. For mixtures, the critical
◦
k = k + [exp (Bρ r) + C] enhancements are significant but the thermal conductivity
(8.38) remains finite [29]. Actual values of critical thermal conduc-
3 1/6 tivity may be substantially different from the values given in
= 4.642 × 10 4 M T c Z c 5
P 4 this table. For example, value of k c from methane as shown
c
by Mathias et al. [29] is 0.079 W/m · K, while the value given
For ρ r < 0.5: A = 2.702, B = 0.535, C =−1.000
in Table 8.4 is 0.0312 W/m · K. However for ethane the value
0.5 <ρ r < 2.0: A = 2.528, B = 0.670, C =−1.069 of k c from this table is the same as obtained from method of
2.0 <ρ r < 2.8: A = 0.574, B = 1.155, C = 2.016 Mathias et al. [29]. Equation (8.39) is mainly recommended
for conditions different from the critical point and as long as
where k is the thermal conductivity of low-pressure (atmo- values of k c from Table 8.4 are used, predicted values from
◦
spheric pressure) gas at given temperature and k is the corre- Eq. (8.39) are reliable.
sponding thermal conductivity at given temperature and pres-
sure of interest. ρ r is the reduced density (V c /V), T c is in K, P c is Example 8.2—Consider n-pentane vapor at 300 C and
◦
in bar, and Z c is the critical compressibility factor. Both k and 100 bar. Calculate its thermal conductivity from Stiel–Thodos
k are in W/m · K. In the API-DTB [5] a generalized correlation and Riazi–Faghri methods.
◦
developed by Crook and Daubert is recommended for calcu-
lation of k of dense hydrocarbon gases. However, this method Solution—From Table 2.1, M = 72.2, ◦
T c = 196.55 C =
requires calculation of isochoric (constant volume) heat ca- 469.7K, P c = 33.7 bar, V c = 313.05 cm /mol, and Z c = 0.2702.
3
pacity (C V ) at the T and P of interest. Another generalized From Eq. (8.33) and coefficients for n-C 5 in Table 8.3 at
correlation for estimation of thermal conductivity of gases at
high pressure was developed by Riazi and Faghri [32]:
TABLE 8.4—Critical thermal conductivity of some pure
k compounds [32].
1
(8.39) k r = = (0.5 − ω)k + ωk 2 r
r
k c Compound k c , W/mK Compound k c , W/mK
Methane 0.0312 Ethene 0.0379
where k r is the reduced thermal conductivity and k is the ther- Ethane 0.0319 Cyclohexane 0.0533
mal conductivity at T and P of interest in W/m · K while k c is Propane 0.0433 Benzene 0.0472
the thermal conductivity at the critical point (T c and P c ). Pa- n-Butane 0.0478 Toluene 0.0526
rameters k (1) and k (2) are determined as a function of T r and n-Heptane 0.0535 Ethylbenzne 0.0526
r r
--`,```,`,``````,`,````,```,,-`-`,,`,,`,`,,`---
Copyright ASTM International
Provided by IHS Markit under license with ASTM Licensee=International Dealers Demo/2222333001, User=Anggiansah, Erick
No reproduction or networking permitted without license from IHS Not for Resale, 08/26/2021 21:56:35 MDT