
Page 368 - Characterization and Properties of Petroleum Fractions - M.R. Riazi
P. 368
P1: JDW
June 22, 2007
14:25
AT029-Manual-v7.cls
AT029-Manual
AT029-08
348 CHARACTERIZATION AND PROPERTIES OF PETROLEUM FRACTIONS
Slattery and Bird [38] developed a generalized chart in terms
of (PD)/(PD) versus T r and P r . The chart is in graphical form
◦
and is based on a very few data on self-diffusion coefficient
∞
D BA of simple gases, which were available six decades ago. Later
Takahashi [39] proposed a similar and identical chart but us-
L
D AB ing more data on self- as well as some binary-diffusion coef-
ficients. Obviously these methods cannot be used with com-
puter tools and use of the charts is inconvenient to obtain
an accurate value of diffusion coefficient. However, Slattery–
∞
D AB Bird chart has been included in the API-TDB [5].
Sigmund [40] measured and reported binary diffusion co-
efficient of dense gases for C 1 ,C 2 ,C 3 , n-C 4 , and N 2 for the
pressure range of 200–2500 psia (14–170 bars), temperature
◦
◦
0 1 range of 38–105 C (100–220 F) and mole fraction range of
X A
0.1–0.9 for methane. Sample of Sigmund’s dataset for some
binary systems are given in Table 8.9. Sigmund also reported
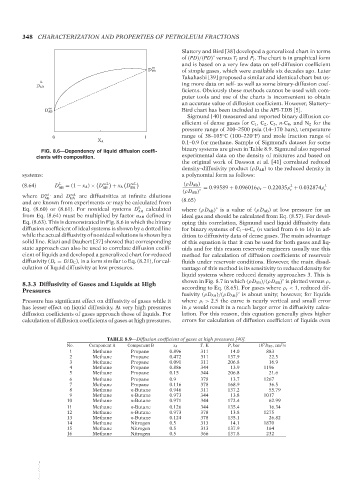
FIG. 8.6—Dependency of liquid diffusion coeffi-
cients with composition. experimental data on the density of mixtures and based on
the original work of Dawson et al. [41] correlated reduced
density–diffusivity product (ρD AB ) to the reduced density in
systems: a polynomial form as follows:
∞L
L
(8.64) D AB = (1 − x A ) × D AB + x A D ∞L (ρD AB) = 0.99589 + 0.096016ρ r − 0.22035ρ + 0.032874ρ 3
2
BA
(ρD AB) ◦ r r
∞L
∞L
where D AB and D BA are diffusivities at infinite dilutions
and are known from experiments or may be calculated from (8.65)
L
Eq. (8.60) or (8.61). For nonideal systems D AB calculated where (ρD AB) is a value of (ρD AB ) at low pressure for an
◦
from Eq. (8.64) must be multiplied by factor α AB defined in ideal gas and should be calculated from Eq. (8.57). For devel-
Eq. (8.63). This is demonstrated in Fig. 8.6 in which the binary oping this correlation, Sigmund used liquid diffusivity data
diffusion coefficient of ideal systems is shown by a dotted line for binary systems of C 1 –n-C n (n varied from 6 to 16) in ad-
while the actual diffusivity of nonideal solutions is shown by a dition to diffusivity data of dense gases. The main advantage
solid line. Riazi and Daubert [37] showed that corresponding of this equation is that it can be used for both gases and liq-
state approach can also be used to correlate diffusion coeffi- uids and for this reason reservoir engineers usually use this
cient of liquids and developed a generalized chart for reduced method for calculation of diffusion coefficients of reservoir
diffusivity (D r = D/D C ), in a form similar to Eq. (8.21), for cal- fluids under reservoir conditions. However, the main disad-
culation of liquid diffusivity at low pressures. vantage of this method is its sensitivity to reduced density for
liquid systems where reduced density approaches 3. This is
◦
8.3.3 Diffusivity of Gases and Liquids at High shown in Fig. 8.7 in which (ρD AB)/(ρD AB) is plotted versus ρ r
Pressures according to Eq. (8.65). For gases where ρ r < 1, reduced dif-
◦
fusivity (ρD AB)/(ρD AB) is about unity; however, for liquids
Pressure has significant effect on diffusivity of gases while it where ρ r > 2.5 the curve is nearly vertical and small error
has lesser effect on liquid diffusivity. At very high pressures in ρ would result in a much larger error in diffusivity calcu-
diffusion coefficients of gases approach those of liquids. For lation. For this reason, this equation generally gives higher
calculation of diffusion coefficients of gases at high pressures, errors for calculation of diffusion coefficient of liquids even
TABLE 8.9—Diffusion coefficient of gases at high pressures [40].
2
5
No. Component A Component B x A T,K P, bar 10 D AB ,cm /s
1 Methane Propane 0.896 311 14.0 883
2 Methane Propane 0.472 311 137.9 22.5
3 Methane Propane 0.091 311 206.8 16.9
4 Methane Propane 0.886 344 13.9 1196
5 Methane Propane 0.15 344 206.8 21.6
6 Methane Propane 0.9 378 13.7 1267
7 Methane Propane 0.116 378 168.9 36.5
8 Methane n-Butane 0.946 311 137.2 55.79
9 Methane n-Butane 0.973 344 13.8 1017
10 Methane n-Butane 0.971 344 172.4 62.99
11 Methane n-Butane 0.126 344 135.4 16.34
12 Methane n-Butane 0.973 378 13.8 1275
13 Methane n-Butane 0.124 378 135.1 26.82
14 Methane Nitrogen 0.5 313 14.1 1870
15 Methane Nitrogen 0.5 313 137.9 164
16 Methane Nitrogen 0.5 366 137.8 232
--`,```,`,``````,`,````,```,,-`-`,,`,,`,`,,`---
Copyright ASTM International
Provided by IHS Markit under license with ASTM Licensee=International Dealers Demo/2222333001, User=Anggiansah, Erick
No reproduction or networking permitted without license from IHS Not for Resale, 08/26/2021 21:56:35 MDT