
Page 372 - Characterization and Properties of Petroleum Fractions - M.R. Riazi
P. 372
P1: JDW
AT029-Manual-v7.cls
14:25
June 22, 2007
AT029-08
AT029-Manual
352 CHARACTERIZATION AND PROPERTIES OF PETROLEUM FRACTIONS
2
−4
(298.2 K) are 0.215 cp and 5.5 × 10
cm /s, respectively.
2
erty and each compound. These constants for a large number
Equation (8.76) gives value of D = 5.1 × 10 −5 cm /s. This in which A, B, and p are constants specific for each prop- --`,```,`,``````,`,````,```,,-`-`,,`,,`,`,,`---
equation is developed based on very few compounds includ- of compounds are given in Ref. [23]. Equation (8.78) is de-
ing polar and nonpolar substances and is not recommended veloped for liquid hydrocarbons. Parameter I is defined in
for accurate estimation of diffusivity. However, it gives a gen- terms of refractive index (n) by Eq. (2.36) and n must be eval-
eral trend between viscosity and diffusivity. Similarly the uated from n 20 using Eq. (2.114) at the same temperature at
following relation was derived between μ, k, and D [37]: which a transport property is desired. Methods of estimation
of refractive index were discussed in Section 2.6.2. The linear
1/2 1.0128
k kT
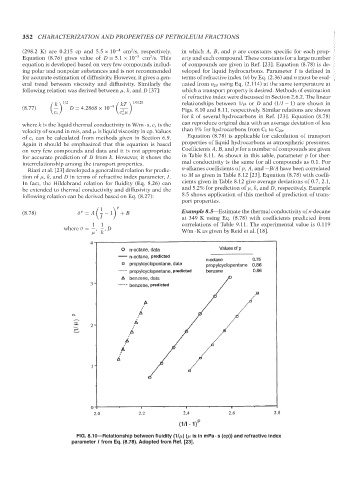
relationships between 1/μ or D and (1/I − 1) are shown in
(8.77) D = 4.2868 × 10 −9 2 Figs. 8.10 and 8.11, respectively. Similar relations are shown
c s c μ
s
for k of several hydrocarbons in Ref. [23]. Equation (8.78)
where k is the liquid thermal conductivity in W/m · s, c s is the can reproduce original data with an average deviation of less
velocity of sound in m/s, and μ is liquid viscosity in cp. Values than 1% for hydrocarbons from C 5 to C 20 .
of c s can be calculated from methods given in Section 6.9. Equation (8.78) is applicable for calculation of transport
Again it should be emphasized that this equation is based properties of liquid hydrocarbons at atmospheric pressures.
on very few compounds and data and it is not appropriate Coefficients A, B, and p for a number of compounds are given
for accurate prediction of D from k. However, it shows the in Table 8.11. As shown in this table, parameter p for ther-
interrelationship among the transport properties. mal conductivity is the same for all compounds as 0.1. For
Riazi et al. [23] developed a generalized relation for predic- n-alkanes coefficients of p, A, and −B/A have been correlated
tion of μ, k, and D in terms of refractive index parameter, I. to M as given in Table 8.12 [23]. Equation (8.78) with coeffi-
In fact, the Hildebrand relation for fluidity (Eq. 8.26) can cients given in Table 8.12 give average deviations of 0.7, 2.1,
be extended to thermal conductivity and diffusivity and the and 5.2% for prediction of μ, k, and D, respectively. Example
following relation can be derived based on Eq. (8.27): 8.5 shows application of this method of prediction of trans-
port properties.
p
1
p
(8.78) θ = A − 1 + B Example 8.5—Estimate the thermal conductivity of n-decane
I at 349 K using Eq. (8.78) with coefficients predicted from
1 1 correlations of Table 9.11. The experimental value is 0.119
where θ = , , D W/m · K as given by Reid et al. [18].
μ k
FIG. 8.10—Relationship between fluidity (1/μ)(μ is in mPa · s (cp)) and refractive index
parameter I from Eq. (8.78). Adopted from Ref. [23].
Copyright ASTM International
Provided by IHS Markit under license with ASTM Licensee=International Dealers Demo/2222333001, User=Anggiansah, Erick
No reproduction or networking permitted without license from IHS Not for Resale, 08/26/2021 21:56:35 MDT