
Page 375 - Characterization and Properties of Petroleum Fractions - M.R. Riazi
P. 375
P1: JDW
June 22, 2007
AT029-Manual
AT029-Manual-v7.cls
AT029-08
14:25
8. APPLICATIONS: ESTIMATION OF TRANSPORT PROPERTIES 355
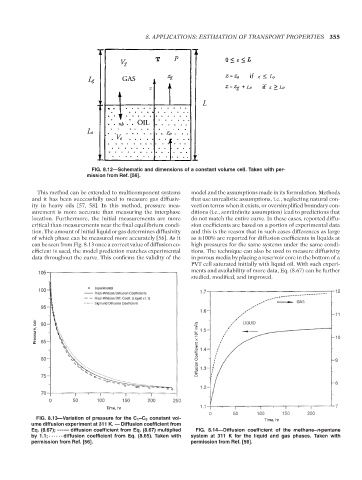
FIG. 8.12—Schematic and dimensions of a constant volume cell. Taken with per-
mission from Ref. [56].
This method can be extended to multicomponent systems model and the assumptions made in its formulation. Methods
and it has been successfully used to measure gas diffusiv- that use unrealistic assumptions, i.e., neglecting natural con-
ity in heavy oils [57, 58]. In this method, pressure mea- vection terms when it exists, or oversimplified boundary con-
surement is more accurate than measuring the interphase ditions (i.e., semiinfinite assumption) lead to predictions that
location. Furthermore, the initial measurements are more do not match the entire curve. In these cases, reported diffu-
critical than measurements near the final equilibrium condi- sion coefficients are based on a portion of experimental data
tion. The amount of initial liquid or gas determines diffusivity and this is the reason that in such cases differences as large
of which phase can be measured more accurately [56]. As it as ±100% are reported for diffusion coefficients in liquids at
can be seen from Fig. 8.13 once a correct value of diffusion co- high pressures for the same systems under the same condi-
efficient is used, the model prediction matches experimental tions. The technique can also be used to measure diffusivity
data throughout the curve. This confirms the validity of the in porous media by placing a reservoir core in the bottom of a
PVT cell saturated initially with liquid oil. With such experi-
ments and availability of more data, Eq. (8.67) can be further
studied, modified, and improved.
Pressure, bar
Diffusion Coefficient × 10 5 , m 2 /s
Time, hr
FIG. 8.13—Variation of pressure for the C 1 –C 5 constant vol- Time, hr
ume diffusion experiment at 311 K. — Diffusion coefficient from
Eq. (8.67); ------ diffusion coefficient from Eq. (8.67) multiplied FIG. 8.14—Diffusion coefficient of the methane–n-pentane
by 1.1; ······ diffusion coefficient from Eq. (8.65). Taken with system at 311 K for the liquid and gas phases. Taken with
permission from Ref. [56]. permission from Ref. [56].
Copyright ASTM International
Provided by IHS Markit under license with ASTM Licensee=International Dealers Demo/2222333001, User=Anggiansah, Erick
No reproduction or networking permitted without license from IHS Not for Resale, 08/26/2021 21:56:35 MDT
--`,```,`,``````,`,````,```,,-`-`,,`,,`,`,,`---