
Page 379 - Characterization and Properties of Petroleum Fractions - M.R. Riazi
P. 379
P1: JDW
June 22, 2007
AT029-Manual
AT029-08
AT029-Manual-v7.cls
8. APPLICATIONS: ESTIMATION OF TRANSPORT PROPERTIES 359
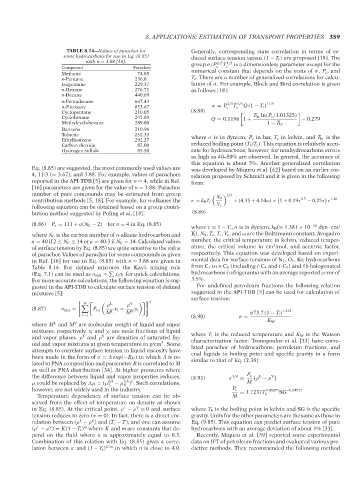
TABLE 8.14—Values of parachor for
some hydrocarbons for use in Eq. (8.85) 14:25 Generally, corresponding state correlation in terms of re-
duced surface tension versus (1 − T r ) are proposed [18]. The
with n = 3.88 [16]. group σ/P 2/3 T 1/3 is a dimensionless parameter except for the
c
c
Compound Parachor numerical constant that depends on the units of σ, P c , and
Methane 74.05
n-Pentane 236.0 T c . There are a number of generalized correlations for calcu-
Isopentane 229.37 lation of σ. For example, Block and Bird correlation is given
n-Hexane 276.71 as follows [18]:
n-Decane 440.69
n-Pentadecane 647.43 2/3 1/3 11/9
n-Eicosane 853.67 σ = P c T c Q (1 − T r)
Cyclopentane 210.05 (8.88) !
Cyclohexane 247.89 Q = 0.1196 1 + T br ln(P c /1.01325) − 0.279
Methylcyclohexane 289.00 1 − T br
Benzene 210.96
Toluene 252.33 where σ is in dyn/cm, P c in bar, T c in kelvin, and T br is the
Ethylbenzene 292.27
Carbon dioxide 82.00 reduced boiling point (T b /T c ). This equation is relatively accu-
Hydrogen sulfide 85.50 rate for hydrocarbons; however, for nonhydrocarbons errors
as high as 40–50% are observed. In general, the accuracy of
this equation is about 5%. Another generalized correlation
Eq. (8.85) are suggested, the most commonly used values are was developed by Miqueu et al. [62] based on an earlier cor-
4, 11/3 (= 3.67), and 3.88. For example, values of parachors relation proposed by Schmidt and it is given in the following
reported in the API-TDB [5] are given for n = 4, while in Ref. form:
[16] parameters are given for the value of n = 3.88. Parachor
number of pure compounds may be estimated from group 2/3
N A 0.5 1.26
contribution methods [5, 18]. For example, for n-alkanes the σ = k B T c × (4.35 + 4.14ω) × 1 + 0.19τ − 0.25τ τ
following equation can be obtained based on a group contri- V c
bution method suggested by Poling et al. [18]: (8.89)
(8.86) P a = 111 + a(N C − 2) for n = 4 in Eq. (8.85) −16
where τ = 1 − T r , σ is in dyn/cm, k B (= 1.381 × 10 dyn · cm/
where N C is the carbon number of n-alkane hydrocarbon and K), N A , T c , T r , V c , and ω are the Boltzmann constant, Avogadro
a = 40 if 2 ≤ N C ≤ 14 or a = 40.3if N C > 14. Calculated values number, the critical temperature in kelvin, reduced temper-
3
of surface tension by Eq. (8.85) are quite sensitive to the value ature, the critical volume in cm /mol, and acentric factor,
of parachor. Values of parachor for some compounds as given respectively. This equation was developed based on experi-
in Ref. [16] for use in Eq. (8.85) with n = 3.88 are given in mental data for surface tensions of N 2 ,O 2 , Kr, hydrocarbons
Table 8.14. For defined mixtures the Kay’s mixing rule from C 1 to n-C 8 (including i-C 4 and i-C 5 ) and 16 halogenated
hydrocarbons (refrigerants) with an average reported error of
(Eq. 7.1) can be used as σ mix = x i σ i for quick calculations.
For more accurate calculations, the following equation is sug- 3.5%.
gested in the API-TDB to calculate surface tension of defined For undefined petroleum fractions the following relation
mixtures [5]: suggested in the API-TDB [5] can be used for calculation of
surface tension:
" n
N L V !
ρ ρ
(8.87) σ mix = P a,i L x i − V y i 1.232
i=1 M M (8.90) σ = 673.7 (1 − T r)
K W
L
V
where M and M are molecular weight of liquid and vapor
mixtures, respectively. x i and y i are mole fractions of liquid where T r is the reduced temperature and K W is the Watson
L
V
and vapor phases. ρ and ρ are densities of saturated liq- characterization factor. Tsonopoulos et al. [33] have corre-
3
uid and vapor mixtures at given temperature in g/cm . Some lated parachor of hydrocarbons, petroleum fractions, and
attempts to correlate surface tension to liquid viscosity have coal liquids to boiling point and specific gravity in a form
been made in the form of σ = Aexp(−Bμ) in which A is re- similar to that of Eq. (2.38):
lated to PNA composition and parameter B is correlated to M
as well as PNA distribution [34]. At higher pressures where
the difference between liquid and vapor properties reduces, (8.91) σ 1/4 = P a ρ − ρ V
L
0.5 0.5 2 M
μ could be replaced by μ = (μ L − μ ) . Such correlations,
V
however, are not widely used in the industry. P a = 1.7237T 0.05873 SG −0.64927
Temperature dependency of surface tension can be ob- M b
served from the effect of temperature on density as shown
V
L
in Eq. (8.85). At the critical point, ρ − ρ = 0 and surface where T b is the boiling point in kelvin and SG is the specific
tension reduces to zero (σ = 0). In fact, there is a direct cor- gravity. Units for the other parameters are the same as those in
L
V
relation between (ρ − ρ ) and (T c − T), and one can assume Eq. (9.85). This equation can predict surface tension of pure
m
V
L
(ρ − ρ ) = K(1 − T r ) where K and m are constants that de- hydrocarbons with an average deviation of about 1% [33].
pend on the fluid where n is approximately equal to 0.3. Recently, Miqueu et al. [59] reported some experimental
Combination of this relation with Eq. (8.85) gives a corre- data on IFT of petroleum fractions and evaluated various pre-
lation between σ and (1 − T r ) 0.3n in which n is close to 4.0. dictive methods. They recommended the following method
--`,```,`,``````,`,````,```,,-`-`,,`,,`,`,,`---
Copyright ASTM International
Provided by IHS Markit under license with ASTM Licensee=International Dealers Demo/2222333001, User=Anggiansah, Erick
No reproduction or networking permitted without license from IHS Not for Resale, 08/26/2021 21:56:35 MDT