
Page 380 - Characterization and Properties of Petroleum Fractions - M.R. Riazi
P. 380
P1: JDW
14:25
AT029-Manual-v7.cls
June 22, 2007
AT029-Manual
AT029-08
360 CHARACTERIZATION AND PROPERTIES OF PETROLEUM FRACTIONS
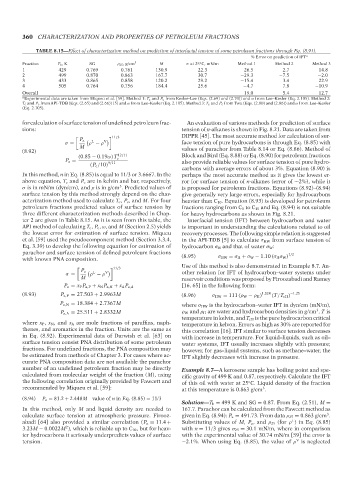
TABLE 8.15—Effect of characterization method on prediction of interfacial tension of some petroleum fractions through Eq. (8.91).
% Error on prediction of IFT a
Fraction T b ,K SG ρ 25 , g/cm 3 M σ at 25 C, mN/m Method 1 Method 2 Method 3
◦
1 429 0.769 0.761 130.9 22.3 26.5 2.7 14.8
2 499 0.870 0.863 167.7 30.7 −29.3 −7.5 −2.0
3 433 0.865 0.858 120.2 29.2 −15.4 3.4 22.9
4 505 0.764 0.756 184.4 25.6 −4.7 7.8 −10.9
Overall 19.0 5.4 12.7
a Experimental data are taken from Miqueu et al. [59]. Method 1: T c and P c from Kesler–Lee (Eqs. (2.69) and (2.70)) and ω from Lee–Kesler (Eq. 2.105). Method 2:
T c and P c from API-TDB (Eqs. (2.65) and (2.66)) [5] and ω from Lee–Kesler (Eq. 2.105). Method 3: T c and P c from Twu (Eqs. (2.80) and (2.86)) and ω from Lee–Kesler
(Eq. 2.105).
for calculation of surface tension of undefined petroleum frac- An evaluation of various methods for prediction of surface
tions: tension of n-alkanes is shown in Fig. 8.21. Data are taken from
DIPPR [45]. The most accurate method for calculation of sur-
! 11/3
P a L V
σ = ρ − ρ face tension of pure hydrocarbons is through Eq. (8.85) with
M
(8.92) values of parachor from Table 8.14 or Eq. (8.86). Method of
(0.85 − 0.19ω) T c 12/11 Block and Bird (Eq. 8.88) or Eq. (8.90) for petroleum fractions
P a = 9/11 also provide reliable values for surface tension of pure hydro-
(P c /10)
carbons with average errors of about 3%. Equation (8.90) is
In this method, nin Eq. (8.85) is equal to 11/3 or 3.6667. In the perhaps the most accurate method as it gives the lowest er-
above equation, T c and P c are in kelvin and bar, respectively, ror for surface tension of n-alkanes (error of ∼2%), while it
3
σ is in mN/m (dyn/cm), and ρ is in g/cm . Predicted values of is proposed for petroleum fractions. Equations (8.92)–(8.94)
surface tension by this method strongly depend on the char- give generally very large errors, especially for hydrocarbons
acterization method used to calculate T c , P c , and M. For four heavier than C 10 . Equation (8.93) is developed for petroleum
petroleum fractions predicted values of surface tension by fractions ranging from C 5 to C 10 and Eq. (8.94) is not suitable
three different characterization methods described in Chap- for heavy hydrocarbons as shown in Fig. 8.21.
ter 2 are given in Table 8.15. As it is seen from this table, the Interfacial tension (IFT) between hydrocarbon and water
API method of calculating T c , P c , ω, and M (Section 2.5) yields is important in understanding the calculations related to oil
the lowest error for estimation of surface tension. Miqueu recovery processes. The following simple relation is suggested
et al. [59] used the pseudocomponent method (Section 3.3.4, in the API-TDB [5] to calculate σ HW from surface tension of
Eq. 3.39) to develop the following equation for estimation of hydrocarbon σ H and that of water σ W :
parachor and surface tension of defined petroleum fractions 1/2
with known PNA composition. (8.95) σ HW = σ H + σ W − 1.10 (σ H σ W)
Use of this method is also demonstrated in Example 8.7. An-
! 11/3
P a L V other relation for IFT of hydrocarbon–water systems under
σ = ρ − ρ
M reservoir conditions was proposed by Firoozabadi and Ramey
[16, 65] in the following form:
P a = x P P a,P + x N P a,N + x A P a,A
(8.93) P a,P = 27.503 + 2.9963M (8.96) σ HW = 111 (ρ W − ρ H) 1.024 (T/T cH) −1.25
P a,N = 18.384 + 2.7367M where σ HW is the hydrocarbon–water IFT in dyn/cm (mN/m),
3
P a,A = 25.511 + 2.8332M ρ W and ρ H are water and hydrocarbon densities in g/cm , T is
temperature in kelvin, and T cH is the pure hydrocarbon critical
where x P , x N , and x A are mole fractions of paraffins, naph- temperature in kelvon. Errors as high as 30% are reported for
thenes, and aromatics in the fraction. Units are the same as this correlation [16]. IFT similar to surface tension decreases
in Eq. (8.92). Experimental data of Darwish et al. [63] on with increase in temperature. For liquid–liquids, such as oil–
surface tension consist PNA distribution of some petroleum water systems, IFT usually increases slightly with pressure;
fractions. For undefined fractions, the PNA composition may however, for gas–liquid systems, such as methane–water, the
be estimated from methods of Chapter 3. For cases where ac- IFT slightly decreases with increase in pressure.
curate PNA composition data are not available the parachor
number of an undefined petroleum fraction may be directly Example 8.7—A kerosene sample has boiling point and spe-
calculated from molecular weight of the fraction (M), using cific gravity of 499 K and 0.87, respectively. Calculate the IFT
the following correlation originally provided by Fawcett and of this oil with water at 25 C. Liquid density of the fraction
◦
recommended by Miqueu et al. [59]: at this temperature is 0.863 g/cm .
3
(8.94) P a = 81.2 + 2.448M value of n in Eq. (8.85) = 11/3
Solution—T b = 499 K and SG = 0.87. From Eq. (2.51), M =
In this method, only M and liquid density are needed to 167.7. Parachor can be calculated from the Fawcett method as
3
calculate surface tension at atmospheric pressure. Firooz- given in Eq. (8.94): P a = 491.73. From data ρ 25 = 0.863 g/cm .
L
abadi [64] also provided a similar correlation (P a = 11.4 + Substituting values of M, P a , and ρ 25 (for ρ ) in Eq. (8.85)
2
3.23M − 0.0022M ), which is reliable up to C 10 , but for heav- with n = 11/3 gives σ 25 = 30.1 mN/m, where in comparison
ier hydrocarbons it seriously underpredicts values of surface with the experimental value of 30.74 mN/m [59] the error is
V
tension. −2.1%. When using Eq. (8.85), the value of ρ is neglected
--`,```,`,``````,`,````,```,,-`-`,,`,,`,`,,`---
Copyright ASTM International
Provided by IHS Markit under license with ASTM Licensee=International Dealers Demo/2222333001, User=Anggiansah, Erick
No reproduction or networking permitted without license from IHS Not for Resale, 08/26/2021 21:56:35 MDT