
Page 374 - Characterization and Properties of Petroleum Fractions - M.R. Riazi
P. 374
P1: JDW
June 22, 2007
AT029-Manual-v7.cls
AT029-Manual
14:25
AT029-08
354 CHARACTERIZATION AND PROPERTIES OF PETROLEUM FRACTIONS
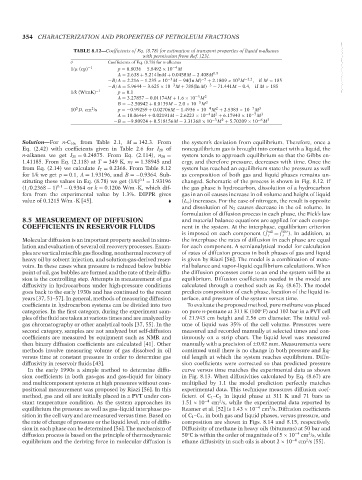
TABLE 8.12—Coefficients of Eq. (8.78) for estimation of transport properties of liquid n-alkanes
with permission from Ref. [23].
θ Coefficients of Eq. (8.78) for n-alkanes
1/μ (cp) −1 p = 0.8036 − 5.8492 × 10 −4 M --`,```,`,``````,`,````,```,,-`-`,,`,,`,`,,`---
A = 2.638 + 5.214 lnM + 0.0458M − 2.408M 0.5
3
−B/A = 2.216 − 1.235 × 10 −3 M − 94(ln M) −5 + 2.1809 × 10 M −2.2 ,if M < 185
−B/A = 5.9644 − 3.625 × 10 −3 M + 788(ln M) −3 − 71.441M − 0.4, if M > 185
1/k (W/mK) −1 p = 0.1
A = 3.27857 − 0.01174M + 1.6 × 10 −5 M 2
B =−2.50942 + 0.0139M − 2.0 × 10 −5 M 2
5
2
2
10 D,cm /s p =−0.99259 + 0.02706M − 1.4936 × 10 −4 M + 2.5383 × 10 −7 M 3
2
A = 10.06464 + 0.02191M − 2.6223 × 10 −4 M + 6.17943 × 10 −7 M 3
2
−B =−9.80924 + 0.518156M − 3.31368 × 10 −3 M + 5.70209 × 10 −6 M 3
Solution—For n-C 10 , from Table 2.1, M = 142.3. From the system’s deviation from equilibrium. Therefore, once a
Eq. (2.42) with coefficients given in Table 2.6 for I 20 of nonequilibrium gas is brought into contact with a liquid, the
n-alkanes we get I 20 = 0.24875. From Eq. (2.114), n 20 = system tends to approach equilibrium so that the Gibbs en-
1.41185. From Eq. (2.118) at T = 349 K, n T = 1.38945 and ergy, and therefore pressure, decreases with time. Once the
from Eq. (2.14) we calculate I T = 0.2368. From Table 8.12 system has reached an equilibrium state the pressure as well
for 1/k we get p = 0.1, A = 1.93196, and B =−0.9364. Sub- as composition of both gas and liquid phases remains un-
stituting these values in Eq. (8.78) we get (1/k) 0.1 = 1.93196 changed. Schematic of the process is shown in Fig. 8.12. If
(1/0.2368 − 1) 0.1 − 0.9364 or k = 0.1206 W/m · K, which dif- the gas phase is hydrocarbon, dissolution of a hydrocarbon
fers from the experimental value by 1.3%. DIPPR gives gas in an oil causes increase in oil volume and height of liquid
value of 0.1215 W/m · K [45]. (L o ) increases. For the case of nitrogen, the result is opposite
and dissolution of N 2 causes decrease in the oil volume. In
formulation of diffusion process in each phase, the Fick’s law
8.5 MEASUREMENT OF DIFFUSION and material balance equations are applied for each compo-
COEFFICIENTS IN RESERVOIR FLUIDS nent in the system. At the interphase, equilibrium criterion
is imposed on each component (f ˆoil = f ˆ gas ). In addition, at
i
i
Molecular diffusion is an important property needed in simu- the interphase the rates of diffusion in each phase are equal
lation and evaluation of several oil recovery processes. Exam- for each component. A semianalytical model for calculation
ples are vertical miscible gas flooding, nonthermal recovery of of rates of diffusion process in both phases of gas and liquid
heavy oil by solvent injection, and solution-gas-derived reser- is given by Riazi [56]. The model is a combination of mate-
voirs. In these cases when pressure is reduced below bubble rial balance and vapor–liquid equilibrium calculations. When
point of oil, gas bubbles are formed and the rate of their diffu- the diffusion processes come to an end the system will be at
sion is the controlling step. Attempts in measurement of gas equilibrium. Diffusion coefficients needed in the model are
diffusivity in hydrocarbons under high-pressure conditions calculated through a method such as Eq. (8.67). The model
goes back to the early 1930s and has continued to the recent predicts composition of each phase, location of the liquid in-
years [37, 51–57]. In general, methods of measuring diffusion terface, and pressure of the system versus time.
coefficients in hydrocarbon systems can be divided into two To evaluate the proposed method, pure methane was placed
categories. In the first category, during the experiment sam- on pure n-pentane at 311 K (100 F) and 102 bar in a PVT cell
◦
ples of the fluid are taken at various times and are analyzed by of 21.943 cm height and 2.56 cm diameter. The initial vol-
gas chromatography or other analytical tools [37, 55]. In the ume of liquid was 35% of the cell volume. Pressures were
second category, samples are not analyzed but self-diffusion measured and recorded manually at selected times and con-
coefficients are measured by equipment such as NMR and tinuously on a strip chart. The liquid level was measured
then binary diffusion coefficients are calculated [41]. Other manually with a precision of ±0.02 mm. Measurements were
methods involve measuring volume of gas dissolved in oil continued until there is no change in both pressure and liq-
versus time at constant pressure in order to determine gas uid length at which the system reaches equilibrium. Diffu-
diffusivity in reservoir fluids [43]. sion coefficients were corrected so that predicted pressure
In the early 1990s a simple method to determine diffu- curve versus time matches the experimental data as shown
sion coefficients in both gas–gas and gas–liquid for binary in Fig. 8.13. When diffusivities calculated by Eq. (8.67) are
and multicomponent systems at high pressures without com- multiplied by 1.1 the model prediction perfectly matches
positional measurement was proposed by Riazi [56]. In this experimental data. This technique measures diffusion coef-
method, gas and oil are initially placed in a PVT under con- ficient of C 1 –C 5 in liquid phase at 311 K and 71 bars as
2
stant temperature condition. As the system approaches its 1.51 × 10 −4 cm /s, while the experimental data reported by
2
equilibrium the pressure as well as gas–liquid interphase po- Reamer et al. [52] is 1.43 × 10 −4 cm /s. Diffusion coefficients
sition in the cell vary and are measured versus time. Based on of C 1 –C 5 , in both gas and liquid phases, versus pressure, and
the rate of change of pressure or the liquid level, rate of diffu- composition are shown in Figs. 8.14 and 8.15, respectively.
sion in each phase can be determined [56]. The mechanism of Diffusivity of methane in heavy oils (bitumens) at 50 bar and
2
diffusion process is based on the principle of thermodynamic 50 C is within the order of magnitude of 5 × 10 −4 cm /s, while
◦
2
equilibrium and the deriving force in molecular diffusion is ethane diffusivity in such oils is about 2 × 10 −4 cm /s [55].
Copyright ASTM International
Provided by IHS Markit under license with ASTM Licensee=International Dealers Demo/2222333001, User=Anggiansah, Erick
No reproduction or networking permitted without license from IHS Not for Resale, 08/26/2021 21:56:35 MDT