Page 154 - Mechanical Behavior of Materials
P. 154

Section 4.6  Compression Test                                              155

                                                 σ

                                    200 MPa  (29 ksi)


                                       0.008


                                                                ε


                                                      7075 - T651 Al


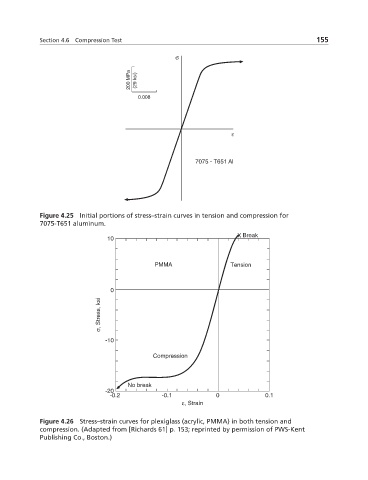
            Figure 4.25 Initial portions of stress–strain curves in tension and compression for
            7075-T651 aluminum.
                                                                  X  Break
                              10


                                           PMMA                 Tension


                               0
                            σ, Stress, ksi


                              -10
                                           Compression


                                    No break
                              -20
                               -0.2          -0.1           0             0.1
                                                   ε, Strain


            Figure 4.26 Stress–strain curves for plexiglass (acrylic, PMMA) in both tension and
            compression. (Adapted from [Richards 61] p. 153; reprinted by permission of PWS-Kent
            Publishing Co., Boston.)
   149   150   151   152   153   154   155   156   157   158   159