
Page 151 - Mechanical Behavior of Materials
P. 151
152 Chapter 4 Mechanical Testing: Tension Test and Other Basic Tests
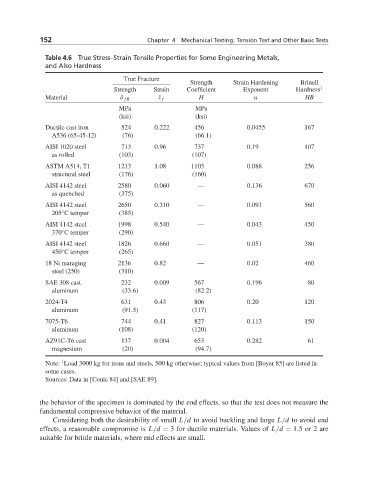
Table 4.6 True Stress–Strain Tensile Properties for Some Engineering Metals,
andAlsoHardness
True Fracture
Strength Strain Hardening Brinell
Strength Strain Coefficient Exponent Hardness 1
Material ˜ σ fB ˜ ε f H n HB
MPa MPa
(ksi) (ksi)
Ductile cast iron 524 0.222 456 0.0455 167
A536 (65-45-12) (76) (66.1)
AISI 1020 steel 713 0.96 737 0.19 107
as rolled (103) (107)
ASTM A514, T1 1213 1.08 1103 0.088 256
structural steel (176) (160)
AISI 4142 steel 2580 0.060 — 0.136 670
as quenched (375)
AISI 4142 steel 2650 0.310 — 0.091 560
◦
205 C temper (385)
AISI 4142 steel 1998 0.540 — 0.043 450
370 C temper (290)
◦
AISI 4142 steel 1826 0.660 — 0.051 380
450 C temper (265)
◦
18 Ni maraging 2136 0.82 — 0.02 460
steel (250) (310)
SAE 308 cast 232 0.009 567 0.196 80
aluminum (33.6) (82.2)
2024-T4 631 0.43 806 0.20 120
aluminum (91.5) (117)
7075-T6 744 0.41 827 0.113 150
aluminum (108) (120)
AZ91C-T6 cast 137 0.004 653 0.282 61
magnesium (20) (94.7)
1
Note: Load 3000 kg for irons and steels, 500 kg otherwise; typical values from [Boyer 85] are listed in
some cases.
Sources: Data in [Conle 84] and [SAE 89].
the behavior of the specimen is dominated by the end effects, so that the test does not measure the
fundamental compressive behavior of the material.
Considering both the desirability of small L/d to avoid buckling and large L/d to avoid end
effects, a reasonable compromise is L/d = 3 for ductile materials. Values of L/d = 1.5or2are
suitable for brittle materials, where end effects are small.