Page 178 - Mechanical Behavior of Materials
P. 178

Problems and Questions                                                     179
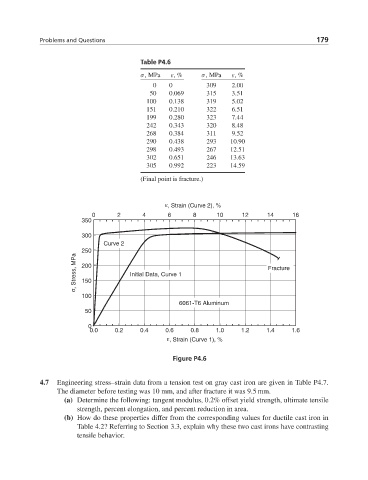

                                       Table P4.6
                                       σ,MPa    ε, %    σ,MPa   ε, %
                                           0   0         309    2.00
                                          50   0.069     315    3.51
                                         100   0.138     319    5.02
                                         151   0.210     322    6.51
                                         199   0.280     323    7.44
                                         242   0.343     320    8.48
                                         268   0.384     311    9.52
                                         290   0.438     293    10.90
                                         298   0.493     267    12.51
                                         302   0.651     246    13.63
                                         305   0.992     223    14.59
                                       (Final point is fracture.)


                                              ε, Strain (Curve 2), %
                          0      2      4      6      8     10     12     14     16
                       350

                       300
                             Curve 2
                       250
                      σ, Stress, MPa  200  Initial Data, Curve 1          Fracture


                       150
                       100
                                                  6061-T6 Aluminum
                        50
                         0
                          0.0   0.2    0.4    0.6    0.8    1.0    1.2    1.4    1.6
                                               ε, Strain (Curve 1), %

                                                Figure P4.6


            4.7  Engineering stress–strain data from a tension test on gray cast iron are given in Table P4.7.
                 The diameter before testing was 10 mm, and after fracture it was 9.5 mm.
                   (a) Determine the following: tangent modulus, 0.2% offset yield strength, ultimate tensile
                      strength, percent elongation, and percent reduction in area.
                   (b) How do these properties differ from the corresponding values for ductile cast iron in
                      Table 4.2? Referring to Section 3.3, explain why these two cast irons have contrasting
                      tensile behavior.
   173   174   175   176   177   178   179   180   181   182   183