
Page 180 - Mechanical Behavior of Materials
P. 180
Problems and Questions 181
Table P4.9
σ,MPa ε, % σ,MPa ε, %
0 0 1803 1.751
276 0.135 1889 2.24
553 0.276 1970 3.00
829 0.421 2013 3.76
1102 0.573 2037 4.50
1303 0.706 2047 5.24
1406 0.799 2039 5.99
1522 0.951 2006 6.73
1600 1.099 1958 7.46
1683 1.308 1893 8.22
1742 1.497
(Final point is fracture.)
Table P4.10
σ, MPa ε,% σ, MPa ε,%
0 0 557 1.819
112 0.165 563 2.30
222 0.322 577 4.02
326 0.474 587 5.98
415 0.605 593 8.02
473 0.703 596 9.52
505 0.797 597 10.97
527 0.953 597 12.50
542 1.209 591 13.90
551 1.498 571 15.33
(Final point is fracture.)
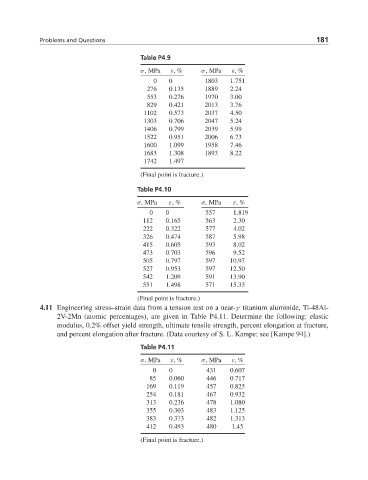
4.11 Engineering stress–strain data from a tension test on a near-γ titanium aluminide, Ti-48Al-
2V-2Mn (atomic percentages), are given in Table P4.11. Determine the following: elastic
modulus, 0.2% offset yield strength, ultimate tensile strength, percent elongation at fracture,
and percent elongation after fracture. (Data courtesy of S. L. Kampe; see [Kampe 94].)
Table P4.11
σ,MPa ε, % σ,MPa ε, %
0 0 431 0.607
85 0.060 446 0.717
169 0.119 457 0.825
254 0.181 467 0.932
313 0.236 478 1.080
355 0.303 483 1.125
383 0.373 482 1.313
412 0.493 480 1.45
(Final point is fracture.)